Let’s explore the SAT score range, conversion of raw scores to scaled scores, and test and SAT score release dates.
How Is the SAT Scored?
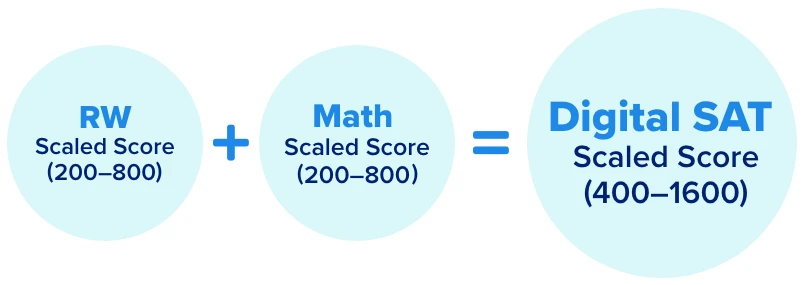
SAT scoring is based on a scale of 400 to 1600. Your final score is the combined total of scores from the Reading and Writing section and the Math section, each of which includes two separately timed adaptive modules. Each section score ranges from 200 to 800, and these are then added together to form your total score, which reflects your overall performance on the exam.


SAT Raw Score Conversion
A raw SAT score is the number of questions you correctly answered. There is no penalty for an incorrect answer, so making an educated guess can only boost your chance of getting the answer correct by 25 percent.
| SAT Scoring | ||
|---|---|---|
| Section | No. of Questions | Raw Score Range |
| Reading and Writing | 54 | 0-54 |
| Math | 44 | 0-44 |
The difficulty level of each question and the skill types it measures are considered while calculating this score. You will access questions aligned to your proficiency level on module 2 of each section.
What Are Scaled Scores?
After your score for each section is calculated, it is converted to a standardized score ranging between 200 and 800, a process known in SAT scoring as scaling. You get 2 scaled scores, 1 each for the Reading and Writing and Math sections.
The College Board® sets this conversion scale, which remains nearly the same every year. However, there can be some changes depending on the test’s difficulty level. For example, on the Math test, a raw score of 42 out of 44 can earn you a scaled score of 800 in some test administrations. On other test administrations, you might need to answer all 44 questions correctly to receive an 800. This method is called equating and is a standardized statistical process to ensure the fairness and validity of the exam score.
Now that you have a clear idea of what makes up your final SAT score, let’s review how the Reading and Writing and Math section scores are calculated.
How Are Each SAT Sections Scored?
Each section of the SAT is scored on a range of 200 to 800. Let’s break down how the raw scores of the Reading and Writing and the Math sections are converted into scaled scores.
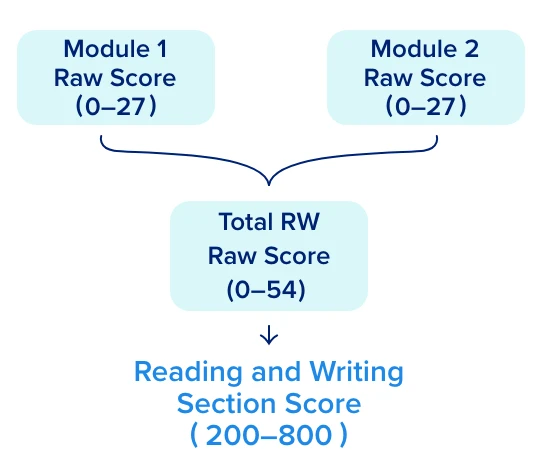
Reading and Writing Section Scoring Structure
In SAT scoring, raw scores from Module 1 and Module 2 of the Reading and Writing section are added together, then the total raw score is converted into a scaled score ranging from 200 to 800.
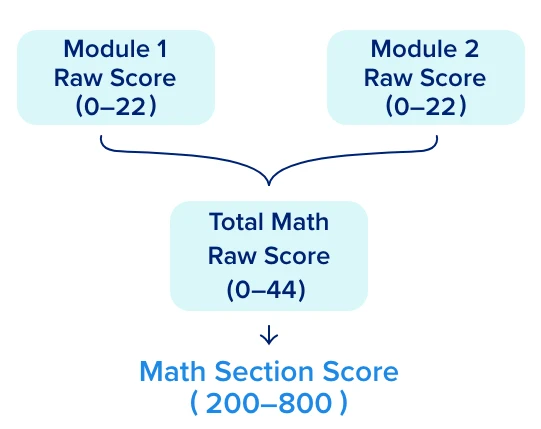
Math Section Scoring Structure
Raw scores from Module 1 and Module 2 of the Math section are added together, then the total raw score is converted into a scaled score ranging from 200 to 800.

2024-26 SAT Test and Score Release Dates
SAT scores are usually released 2 to 3 weeks after the testing date. If you’re interested in learning about SAT score release dates and how to view your score, read our blog on What To Expect on Digital SAT Score Release Day.
| SAT Test Date | SAT Score Release Date |
|---|---|
| November 2, 2024 | November 15, 2024 |
| December 7, 2024 | December 20, 2024 |
| March 8, 2025 | TBD |
| May 3, 2025 | TBD |
| June 7, 2025 | TBD |
| August 23, 2025* | TBD |
| October 4, 2025* | TBD |
| November 8, 2025* | TBD |
| December 6, 2025* | TBD |
| March 14, 2026* | TBD |
| May 2, 2026* | TBD |
| June 6, 2026* | TBD |
* College Board anticipated test dates subject to change.
How to Get Digital SAT Scores
There are 3 ways to get your SAT score:
- Online: The easiest way to access your SAT score is through the College Board website. Simply log in to your My SAT account.
- By mail: If you don’t have a College Board account and did your registration via mail, you will automatically receive your score on paper in the mail.
- By phone: For a fee, you may also receive your score by calling (866) 756-7346.
To learn about the components of the SAT score report, read our blog on How to Interpret the Digital SAT Score Report.
Frequently Asked Questions (FAQs)
Is the SAT graded on a 1600 scale?
What does the term “SAT percentiles” refer to?
What is the average SAT score?
What is a good SAT score?
What is a bad SAT score?
How do I send SAT scores to colleges?
How does superscoring work?
How long are SAT scores valid?
What SAT score is required for a full scholarship?
How do I cancel SAT scores?
How do I verify my SAT score?
Is it better to have a good GPA or a high SAT score?


References
- The Digital SAT® Suite of Assessments Specifications Overview. (2022). satsuite.collegeboard.org. Retrieved November 2023, from https://satsuite.collegeboard.org/media/pdf/digital-sat-test-spec-overview.pdf
- Digital SAT Sample Questions and Explanations. (n.d.). satsuite.collegeboard.org. Retrieved December 2023, from https://satsuite.collegeboard.org/media/pdf/digital-sat-sample-questions.pdf
- Spring 2024 SAT Student Guide for Testing in the U.S. (n.d.). satsuite.collegeboard.org. Retrieved December 2023, from https://satsuite.collegeboard.org/media/pdf/sat-student-guide.pdf
- Understanding Digital SAT Scores. (2023). satsuite.collegeboard.org. Retrieved December 2023, from https://satsuite.collegeboard.org/media/pdf/digital-sat-understanding-scores.pdf
- Your SAT Score Report Explained – SAT Suite | College Board. (n.d.). https://satsuite.collegeboard.org/sat/scores/understanding-scores/your-score-report-explained
- SAT Participation and Performance (2024, November 12). College Board Blog. https://reports.collegeboard.org/media/pdf/2024-total-group-sat-suite-of-assessments-annual-report-ADA.pdf
Related Articles
Considering taking the SAT? This guide covers everything you need to know, including benefits, difficulty, key topics, dates, and more to help you prepare effectively.
SAT Test FormatThis resource has everything you need to know about the SAT structure, including insights on the exam's duration, question types, and useful tips to help you prepare.
SAT SyllabusHave you started studying for the SAT? Follow this guide to explore everything about the SAT syllabus, question types, and the weightage of different test components.
How to Study for the SATStruggling with your SAT test prep? Discover the most effective test-taking strategies, a comprehensive study plan, and expert tips to help you boost your SAT score.