
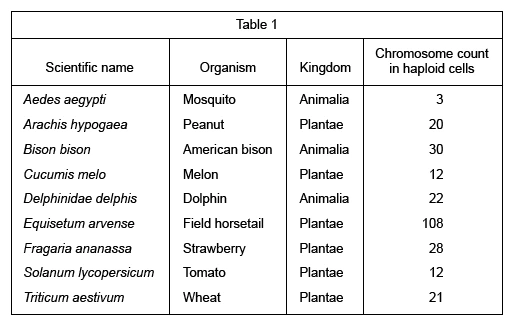
Chromosomes are structures composed of DNA and proteins that store genetic information within cells. The term ploidy is used to refer to the number of chromosome sets that a cell contains. Haploid (n) cells contain a single set of chromosomes. Table 1 identifies the number of chromosomes found in the haploid cells of various organisms along with their scientific names and classifications.
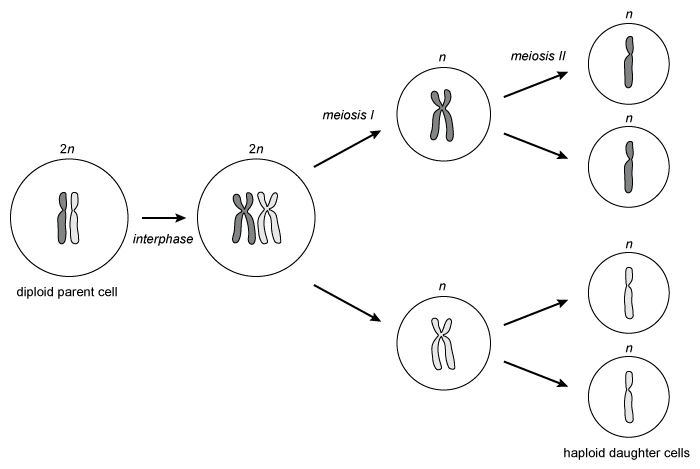
Although it is possible for some organisms to have polyploid cells (cells with more than 2 full sets of chromosomes), the majority of plant and animal somatic (non-sex) cells have 2 sets of chromosomes; these are referred to as diploid (2n) cells. In sex cells, the number of sets of chromosomes are reduced as a result of a specialized type of cell division called meiosis.
Before meiosis can begin, the DNA of a diploid parent cell is replicated during part of the cell cycle called interphase. After interphase, 2 sequential rounds of cell division (meiosis I and meiosis II) result in 4 haploid daughter cells. Figure 1 illustrates interphase and meiosis.
Which number represents the highest chromosome count in haploid cells of an organism in the kingdom Animalia?
- 30
- 60
- 108
- 216
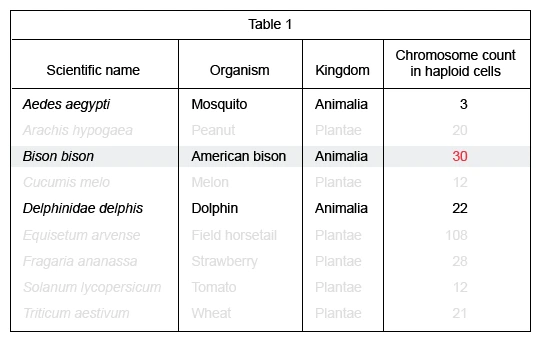
Analyze the chromosome counts, shown in Table 1, to determine the highest for organisms in the kingdom Animalia.
Table 1 shows that the American bison had a chromosome count of 30, which was the highest count in the kingdom Animalia.
(Choice B) 60 may result from mistakenly multiplying the chromosome count of American bison by two to find the diploid, instead of the haploid, count.
(Choice C) 108 represents the highest chromosome count in haploid cells for the organisms listed from the kingdom Plantae, instead of Animalia.
(Choice C) 216 represents the highest chromosome count in diploid, not haploid, cells for an organism listed from the kingdom Plantae, instead of Animalia.
Things to remember:
Use information in the question to help find the answer, particularly when relating information to a data presentation.
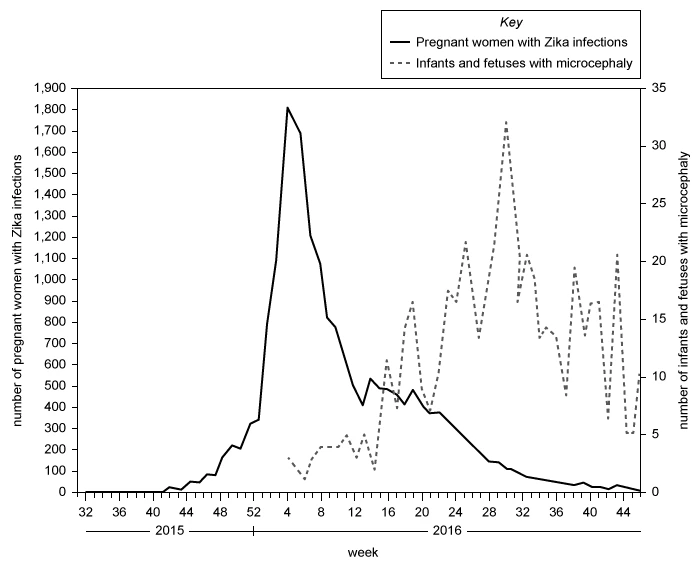
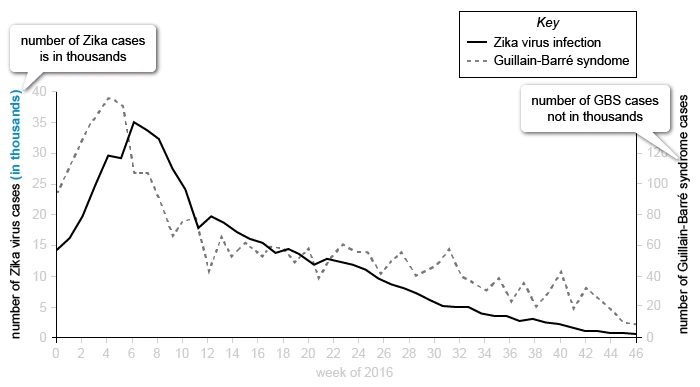
Viruses such as Zika impact human health. Figure 1 shows the number of Zika virus infections and the number of reported Guillain-Barré syndrome (GBS) cases for the same region during 46 weeks of a study in 2016. Scientists noted that in areas affected by Zika, there were increased reports of GBS in adults indicating that GBS may be linked to Zika virus infections. Figure 2 shows the number of new microcephaly cases among infants and fetuses along with the number of pregnant women who were positively diagnosed with Zika infections. This figure is consistent with the hypothesis that Zika infection in pregnant women can result in microcephaly in infants and fetuses.
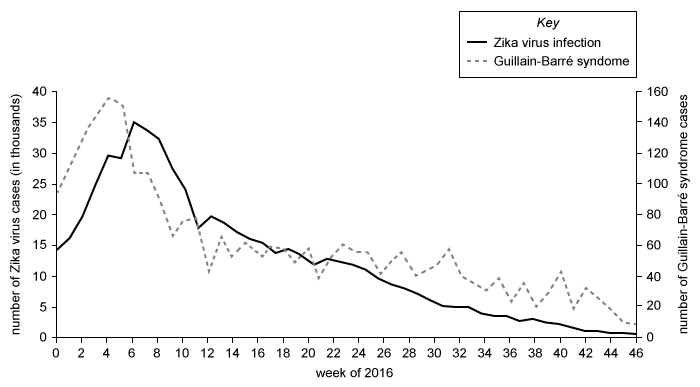
Is the statement, “Only a small number of people with recent Zika virus infection develop GBS,” supported by the results in Figure 1?
- No, because all the patients with Zika developed GBS.
- No, because only a small number of patients with Zika developed GBS.
- Yes, because all the patients with Zika developed GBS.
- Yes, because only a small number of patients with Zika developed GBS.
Scientists noted that in areas affected by Zika, there were increased reports of GBS in adults indicating that GBS may be linked to Zika virus infections.
Analyze the passage and Figure 1 to determine if the given statement is supported by the results.
According to the passage, scientists noticed that GBS cases may be linked to Zika infections.
According to Figure 1:
- The general trend for the number of patients with GBS follows a pattern similar to that of the number of patients with Zika infection.
- The Zika graph ranges from approximately 1,000 to 35,000 cases (left y-axis).
- The GBS graph ranges from approximately 10 to 158 cases (right y-axis).
This data indicates that “Yes;” the statement is supported by the results shown in Figure 1 because only a small number of patients with Zika developed GBS.
(Choices A and C) Although the graphs that represent the numbers of Zika and GBS cases follow the same trend, the axes for the graphs in Figure 1 show that only a small number of patients, not all patients, with Zika develop GBS.
(Choice B) The trends for Zika and GBS seem to follow a similar pattern, indicating that they may be associated.
Things to remember:
Check the scale and units of the measurements when analyzing a graph.
Phthalates are chemicals that are added to plastics to make them soft and flexible. Because phthalates are not chemically bound to the plastics to which they are added, they can be released into the environment. Two experiments examined how the shape and concentration of iron oxide (Fe2O3) nanoparticles affect the degradation (chemical breakdown) of environmental dibutyl phthalate (DBP) upon exposure to light and hydrogen peroxide (H2O2).
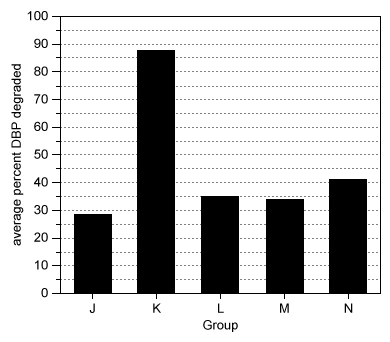
Each of 15 identical beakers received 100 mL of a DBP solution with a concentration of 13 mg/L. The beakers were equally divided into 5 groups (Groups J–N). For each group of beakers, Fe2O3 nanoparticles with 1 of 5 different shapes were added to achieve a nanoparticle concentration of 0.30 mg/mL (see Table 1).

Each beaker then received 50 microliters (µL) of H2O2 and was placed on a magnetic stirrer located 20 cm from a 250 W light source. After 60 min, the concentration of DBP in each beaker was measured, and the average percent DBP degraded in each group was calculated (see Figure 1).
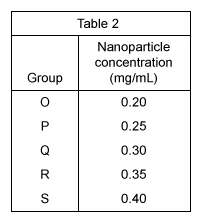
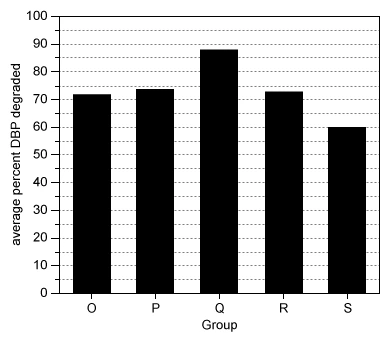
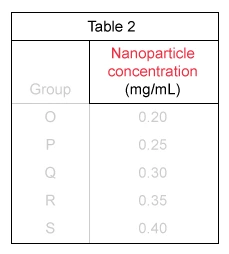
Each of 15 identical beakers received 100 mL of a DBP solution with a concentration of 13 mg/L. The beakers were then equally divided into 5 groups (Groups O–S). Each beaker received 50 µL of H2O2 and was placed on a magnetic stirrer located 20 cm from a 250 W light source. For each group of beakers, hollow-shaped Fe2O3 nanoparticles were then added at 1 of 5 different nanoparticle concentrations (see Table 2).
After 60 min, the average percent DBP degraded in each group was determined as in Experiment 1 (see Figure 2).
Consider the units of measurement “µL” and “mg/mL” in Experiment 2. Which of the following phrases best describes the quantities represented by these units?
-
µL mg/mL
- mass of H2O2 duration of nanoparticle exposure
- mass of H2O2 nanoparticle concentration
- volume of H2O2 duration of nanoparticle exposure
- volume of H2O2 duration of nanoparticle concentration
-
µL mg/mL
- mass of H2O2 duration of nanoparticle exposure
- mass of H2O2 nanoparticle concentration
- volume of H2O2 duration of nanoparticle exposure
- volume of H2O2 duration of nanoparticle concentration
Experiment 2 : Each beaker received 50 µL of H2O2…. For each group of beakers, hollow shaped Fe2O3 nanoparticles were then added at 1 of 5 different nanoparticle concentrations (see Table 2).
Read the passage and analyze the results of Experiment 2, shown in Table 2, to determine which choice best describes the quantities represented by “µL” and “mg/mL.”
According to the passage, 50 µL of H2O2 was added to each beaker in Experiment 2.
|
|
Prior Knowledge: Units that involve liters, including microliters (millionth of a liter) typically are a measure of volume. |
Table 2 shows that the unit for nanoparticle concentration in Experiment 2 is “mg/mL.”
Therefore, the phrase that best describes the quantity represented by “µL” is the volume of H2O2, and the phrase that best describes the quantity represented by “mg/mL” is the nanoparticle concentration.
(Choices A and B) “µL” is a unit of volume, not mass.
(Choice C) Although “µL” is the unit representing the volume of H2O2, the unit “mg/mL” represents the concentration of the nanoparticles, not the duration of exposure to the nanoparticles.
Things to remember:
The quantities represented by particular units can be determined by using information given in the passage about the quantities and by obtaining information from the figures.
Researchers discovered that some pitcher plants have adapted to a mutualistic relationship (when members of different species benefit each other) with 2 members of the class Mammalia. In a study of pitcher plants (Nepenthes rajah), researchers compared the scat (animal feces) from tree shrews (Tupaia montana) and summit rats (Rattus baluensis) inside and outside the pitcher plant. Figure 1 shows 2 locations of scat in relation to a pitcher plant (inside and outside). Figure 1 also shows, for each of the animals and locations, daily deposit rates of scat.
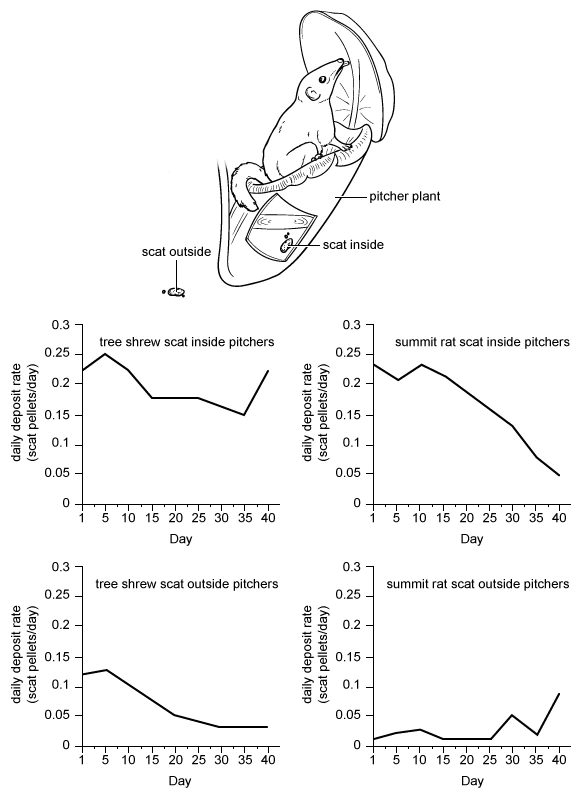
Figure 1
Figure 2 shows tree shrew and summit rat visitation rates to pitcher plants per time of day over a complete day.
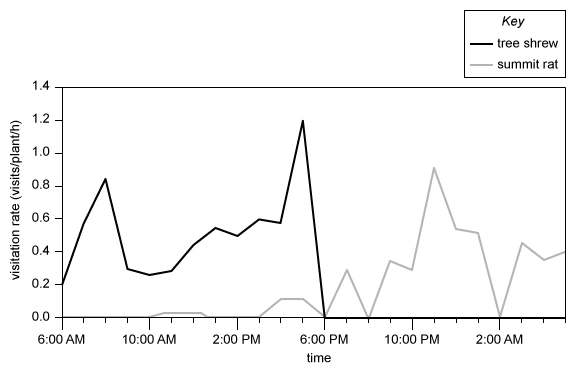
Figure 2
The researchers determined the mammalian scat that fell inside the pitcher plants was broken down and used by the plants to produce nectar. The researchers determined the sugar content of nectar for daylight hours and nighttime hours. The 2 times of day and the corresponding sugar percentage in nectar are shown in the table below.
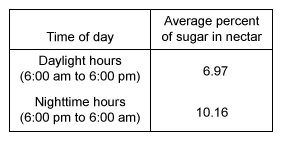
What is the relationship, if any, between tree shrew scat and the average percentage of sugar in nectar?
- As tree shrew scat decreases, the average percentage of sugar in nectar increases only.
- As tree shrew scat decreases, the average percentage of sugar in nectar decreases only.
- As tree shrew scat decreases, the average percentage of sugar in nectar first decreases and then increases.
- There is no relationship between tree shrew scat and the average percentage of sugar in nectar.
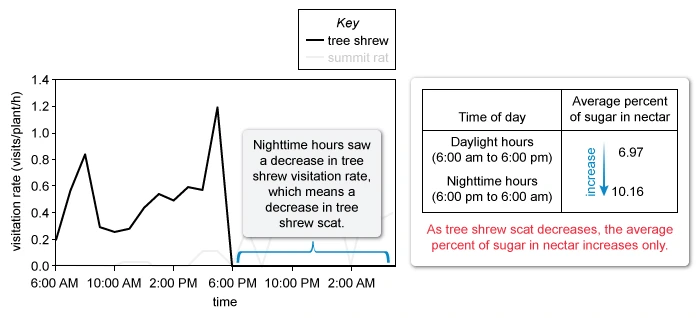
Analyze data relating to the time of day in which tree shrew visited the pitcher plant, shown in Figure 2 and the given table, to find if a relationship between tree shrew scat and the average percentage of sugar in nectar can be established.
Figure 2 and the table show:
- Tree shrews stopped visiting pitcher plants during nighttime hours.
- Sugar content in nectar increased during nighttime hours.
Therefore, as tree shrew scat decreases, the average percentage of sugar in nectar increases only.
(Choices B and C) According to the data table in the question, when the tree shrew scat decreased (nighttime hours), the nectar did not decrease only, nor did it first decrease and then increase.
(Choice D) Although multiple data sets would need to be analyzed to confirm the relationship, it can be determined that there is a relationship between tree shrew scat and the average percentage of sugar in nectar.
Things to remember:
It may be required to analyze data in multiple figures to determine if a relationship between variables exists.
For anti-wrinkle molecules in cosmetics to be effective, they must be able to permeate (spread throughout) the skin. The extent of permeation of a molecule into the skin depends upon several factors, including the molecule’s molecular weight and whether it is hydrophilic (“water-loving”) or lipophilic (“lipid-loving”).
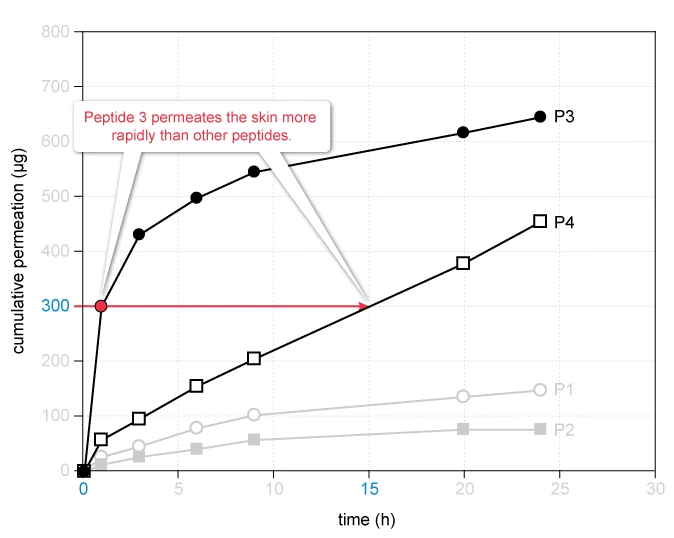
A commonly used measure of lipophilicity is LogP. Table 1 lists the names, abbreviations, and LogP values for each of 4 anti-wrinkle molecules. Propylene glycol (PG) can be used to dissolve molecules prior to their application to the skin. Figure 1 shows how cumulative permeation of the skin at 24 hours varies for each molecule with the concentration of PG. Figure 2 shows how cumulative permeation of the skin varies with time for each molecule dissolved in 100% PG.
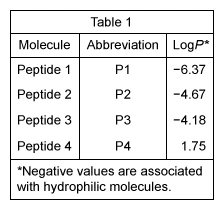
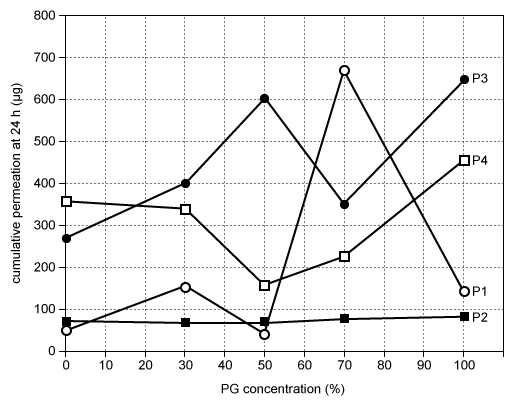
Figure 1
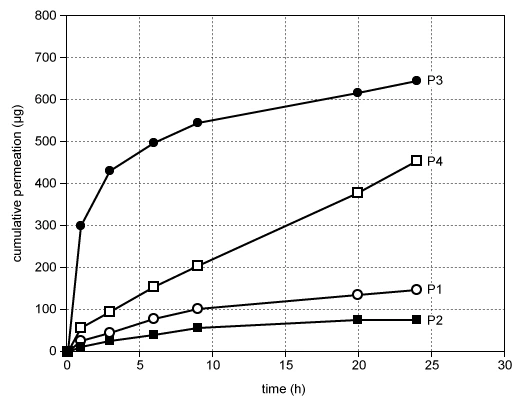
Figure 2
Which of the following conclusions is plausible from the information provided in Figure 2?
- Peptide 2 is the most effective anti-wrinkle molecule available.
- Peptide 4 is absorbed the most over time.
- Peptide 3 permeates the skin more rapidly than other peptides.
- Peptide 1 permeates faster when dissolved in 50% PG.
Examine Figure 2 to find which conclusion is most plausible based on the data.
Figure 2 shows:
- Cumulative permeation on the y-axis and time on the x-axis.
- P3 has a cumulative permeation of approximately 300 µg at 1 hour.
- P4 has a cumulative permeation of approximately 300 µg at 15 hours.
- P1 and P2 never reached a cumulative permeation of 300 µg.
Because more P3 permeates the skin than any other peptide in a shorter time, it can be determined that Peptide 3 permeates the skin more rapidly than other peptides.
(Choice A) P2 permeates the skin to a lesser extent than the other peptides. Therefore, it is not plausible to conclude that P2 is the most effective anti-wrinkle molecule available.
(Choice B) Figure 2 shows that P3, not P4, is absorbed the most over time.
(Choice D) Figure 2 does not provide any information about the permeation of the molecules when they are dissolved in different concentrations of PG, so it is not plausible to conclude that P1 permeates the skin fastest when dissolved in 50% PG.
Things to remember:
A plausible conclusion that is based on a figure will pertain directly to the specific information presented in the figure.


I got a 35 from studying using UWorld, it has the best question bank along with the most informative explanations.”
A useful feature is the timed mode - I was able to stay within the time constraints for the ACT, especially in the science section. Overall, I would recommend UWorld for anyone who is looking to improve their ACT score; it will not disappoint.”
I think UWorld ACT is really well done and is quite accurate, especially with the math and science questions. I also used it for English and my score improved just this week! Thanks UWorld!