y
/
6
=
x
/
2
– 1
ax – y = 3
In the system of linear equations above, a is a constant. If the system has no solution, what is the value of a ?
Submit Next Question
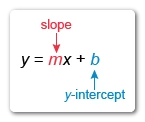
Hint: Rewrite both equations in slope-intercept form y = mx + b, where m is the slope and b is the y-intercept.
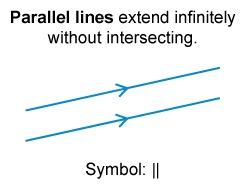
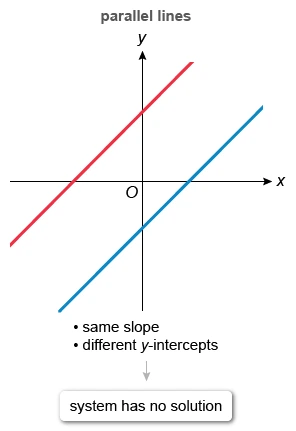
It is given that the system has no solution, so its graph must consist of lines that do not intersect. Therefore, the lines must be parallel. Parallel lines have the same slope and different y-intercepts.
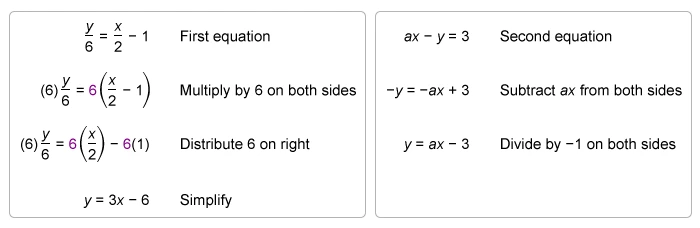
To determine the value of a, first rewrite each equation in slope-intercept form y = mx + b, where m is the slope and b is the y-intercept.
Compare the two equations to see that the y-intercepts are different (−6 ≠ −3), and then identify what value of a will make the slopes the same.
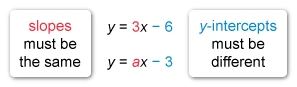
The value of a is 3.
Things to remember:
- A system has no solution if its graph consists of two parallel lines because parallel lines never intersect.
- Parallel lines have the same slope and different y-intercepts.
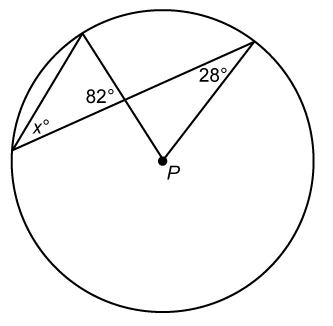
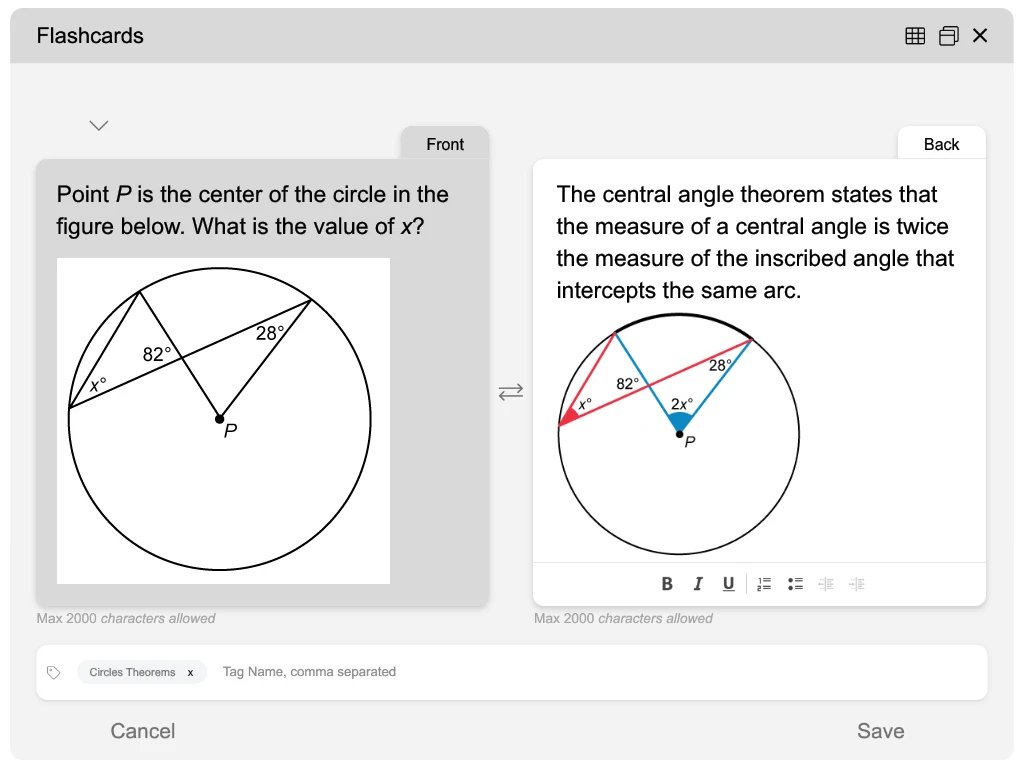
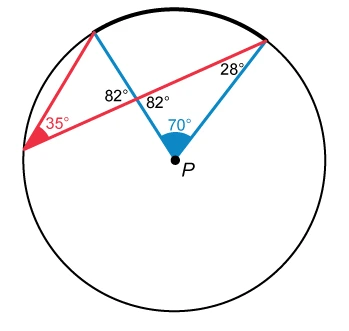
Point P is the center of the circle in the figure above. What is the value of x ?
- 28
- 31
- 35
- 70
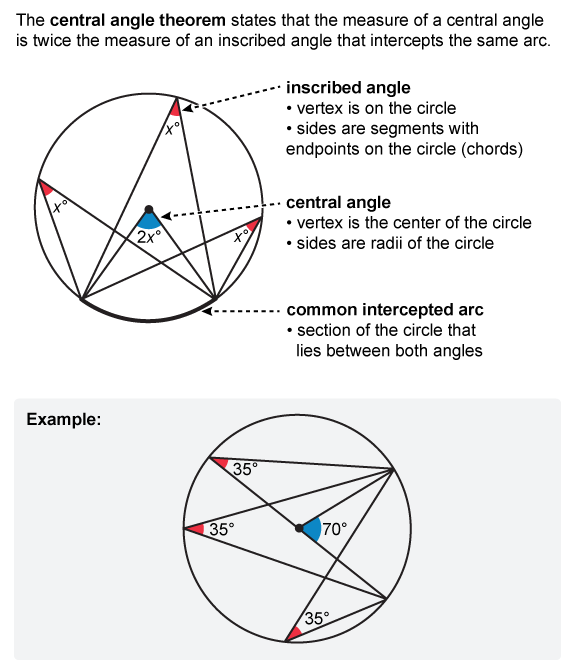
Hint : The measure of a central angle is twice the measure of an inscribed angle that intercepts the same arc. The inscribed angle shown below has a measure of x°, so the measure of central angle P must be 2x°.
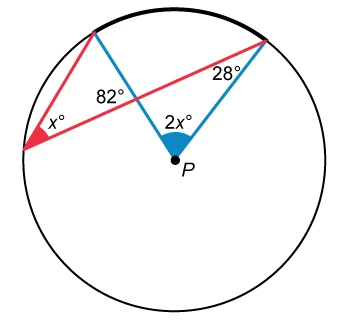
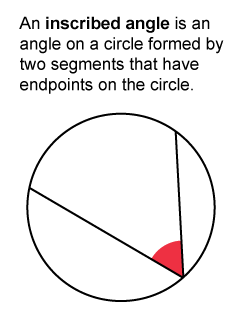
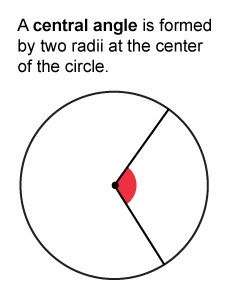
Notice that the x° angle is an inscribed angle and angle P is a central angle. The central angle theorem states that the measure of a central angle is twice the measure of an inscribed angle that intercepts the same arc.
This means the measure of central angle P is 2x° because it intercepts the same arc as the x° inscribed angle.
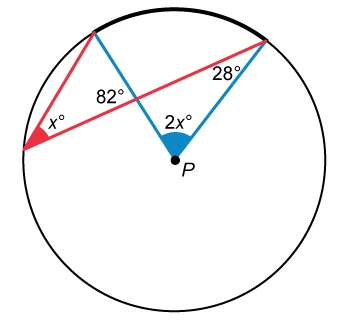
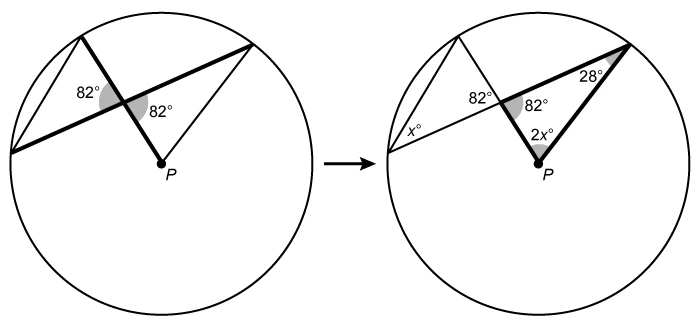
To calculate x, use the right-most triangle that contains both the 2x° and 28° angles. The third angle in this triangle and the 82° angle are vertical angles, so they both have a measure of 82°.
The measures of the interior angles of a triangle sum to 180°. Add these three measures together and set that equal to 180 to solve for x.
| 82 + 2x + 28 = 180 | Sum of measures of interior angles of a triangle is 180° |
| 2x + 110 = 180 | Simplify |
| 2x = 70 | Subtract 110 from both sides |
| x = 35 | Divide both sides by 2 |
(Choice A) 28 may be a result of mistakenly identifying the x° angle as having the same measure as the 28° angle rather than using the relationship between the measures of an inscribed angle and a central angle to find x.
(Choice B) 31 may be a result of mistakenly calculating the value of x with the equation 90 + 2x + 28 = 180 rather than 82 + 2x + 28 = 180.
(Choice D) 70 is the measure of central angle P in degrees, but the question asks for the value of x. It may also be a result of mistakenly calculating the value of x with the equation 82 + x +28 = 180 rather than 82 + 2x + 28 = 180.
Things to remember:
- The measure of a central angle is twice the measure of an inscribed angle that intercepts the same minor arc.
- The measures of the interior angles of a triangle sum to 180°.
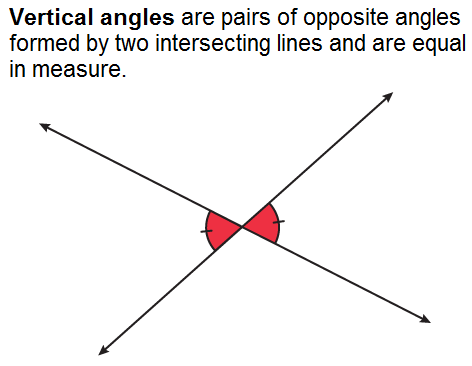
- When two lines intersect, they form pairs of vertical angles that are equal in measure.
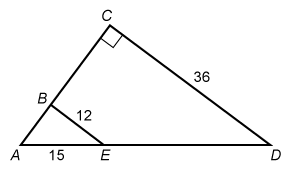
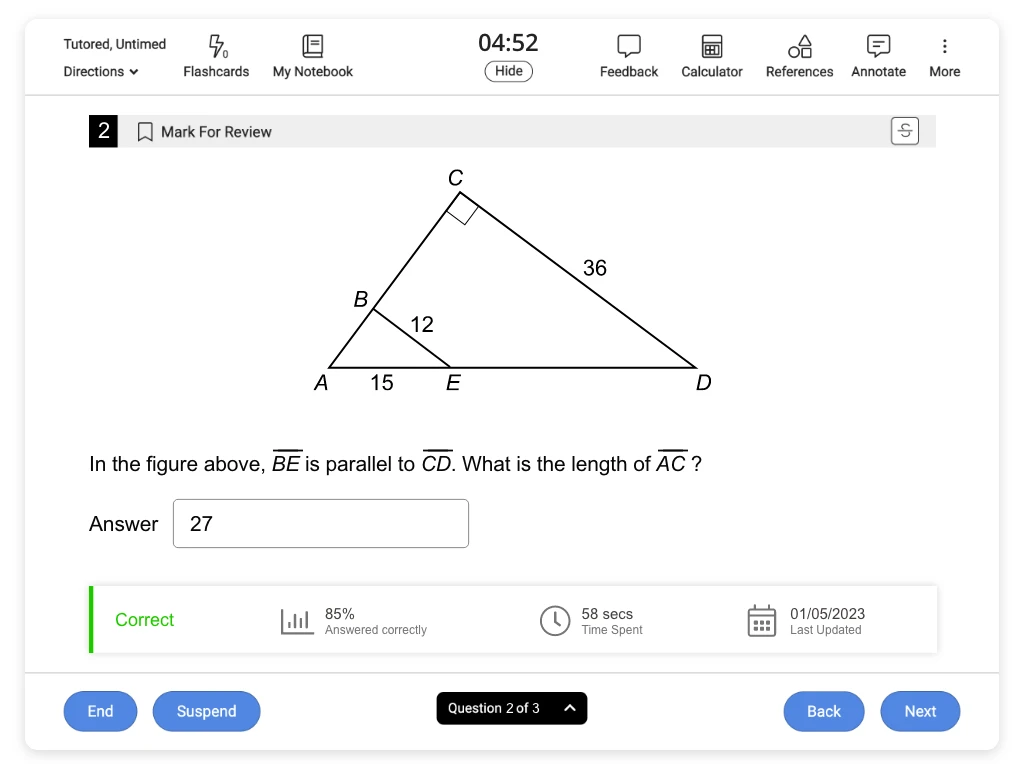
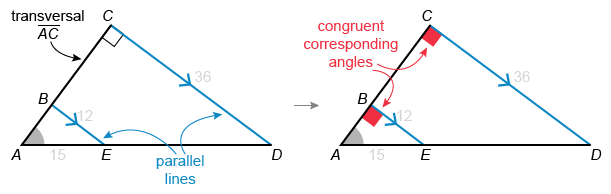
In the figure above, BE is parallel to CD. What is the length of AC ?
Submit Next Question
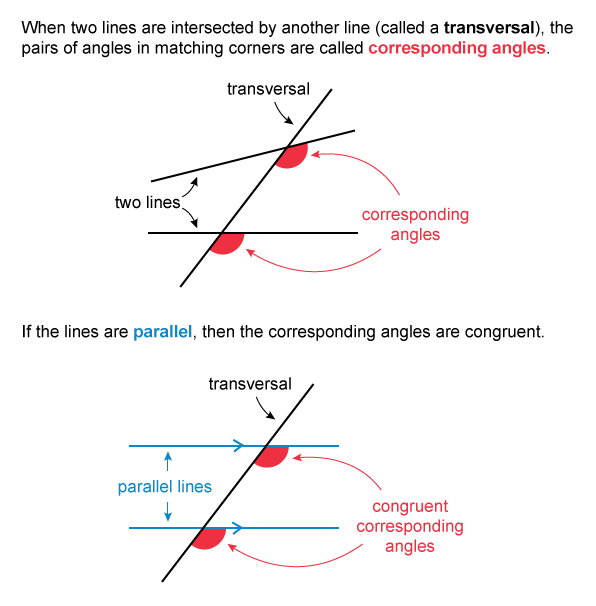
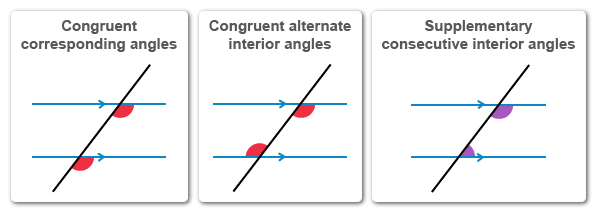
Hint : When parallel lines are cut by a transversal, congruent corresponding angles are formed.
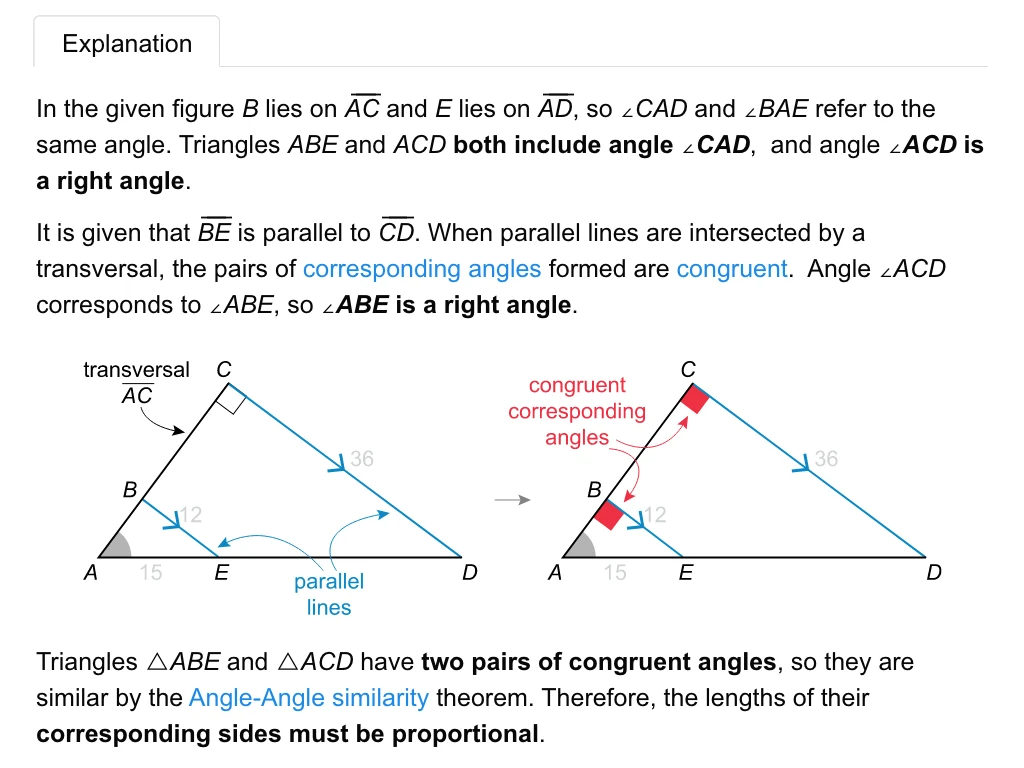
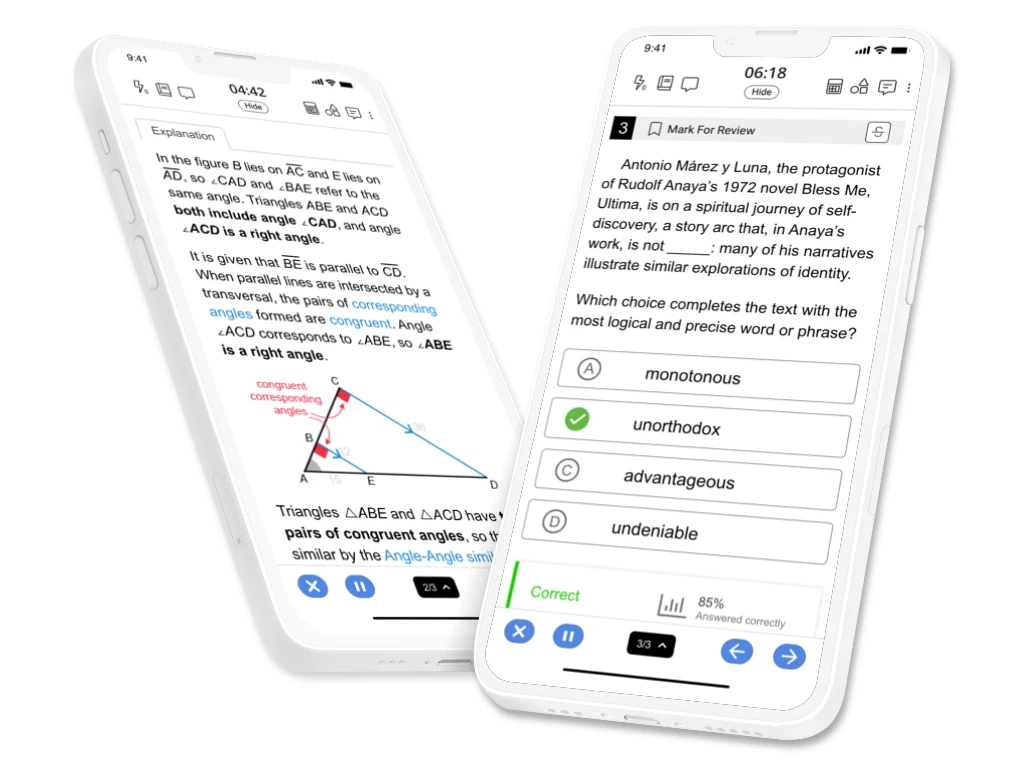
In the given figure B lies on AC and E lies on AD, so ∠CAD and ∠BAE refer to the same angle. Triangles ABE and ACD both include angle ∠CAD, and angle ∠ACD is a right angle.
It is given that BE is parallel to CD . When parallel lines are intersected by a transversal, the pairs of corresponding angles formed are congruent. Angle ∠ACD corresponds to ∠ABE, so ∠ABE is a right angle.
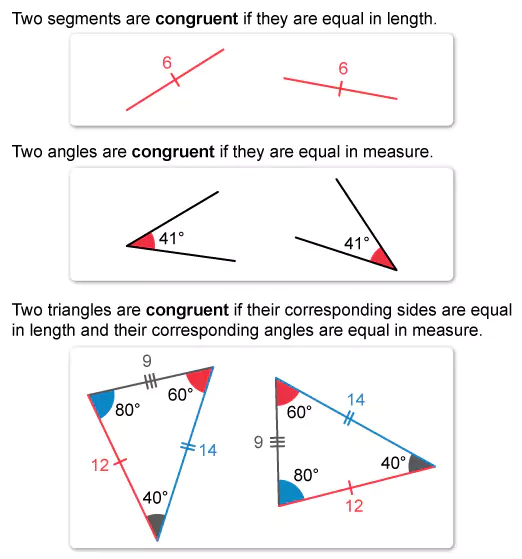
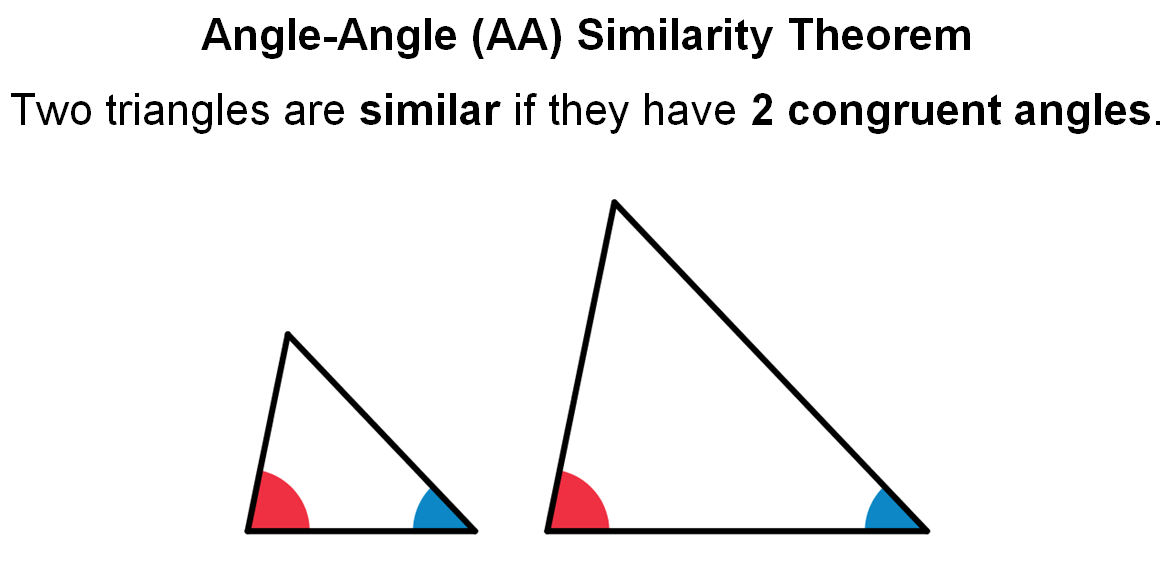
Triangles △ABE and △ACD have two pairs of congruent angles, so they are similar by the Angle-Angle similarity theorem. Therefore, the lengths of their corresponding sides must be proportional.
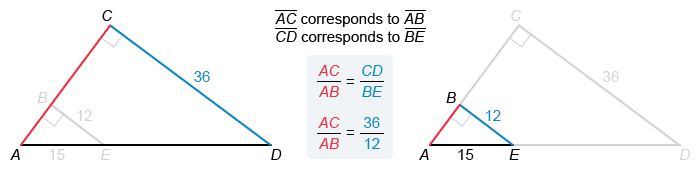
Side AC corresponds to AB, and CD corresponds to BE. Set the ratio of AC to AC equal to the ratio of CD to BE ( AC / AB = CD / BE ). Then plug the side lengths from the given figure into the proportion.
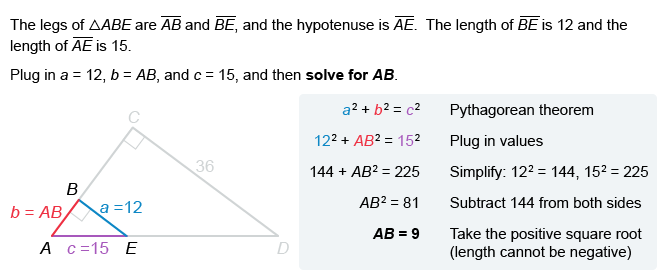
The given length of CD is 36 and the length of BE is 12. Use the Pythagorean theorem with right triangle △ABE to find that the length of leg AB is 9. Plug this value into the proportion, and then solve for the value of AC.
| AC / AB = 36 / 12 | Proportion of side lengths |
| AC / 9 = 36 / 12 | Plug in AB = 9 |
| AC / 9 = 3 | Simplify on the right |
| AC = 27 | Multiply both sides by 9 |
The length of AC is 27.
Note: It is also possible to notice that the given lengths of leg BE (12) and hypotenuse AE (15) form a 9-12-15 Pythagorean triple to determine that the length of AB must be 9.
Things to remember:
- When parallel lines are cut by a transversal, the following pairs of angles are formed:
- Triangles that have two pairs of congruent angles are similar (Angle-Angle similarity theorem). Corresponding side lengths of similar triangles are proportional.
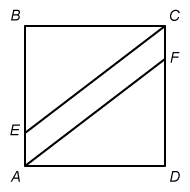
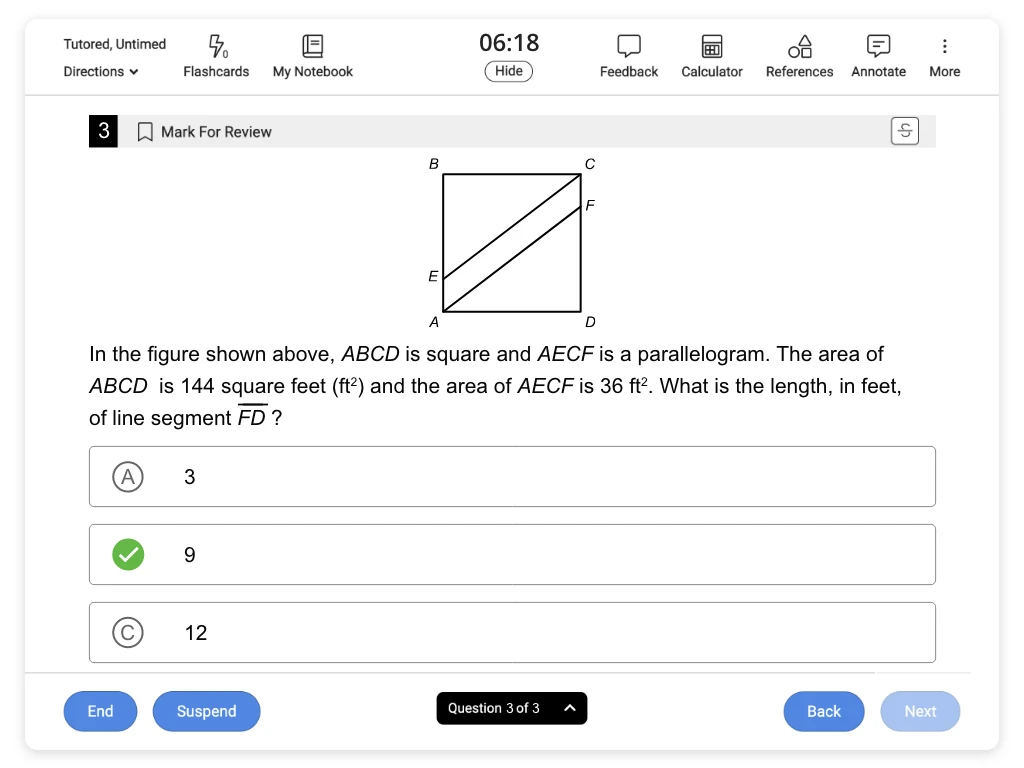
In the figure shown above, ABCD is a square and AECF is a parallelogram. The area of ABCD is 144 square feet (ft2) and the area of AECF is 36 ft2. What is the length, in feet, of line segment FD ?
- 3
- 9
- 12
- 15
Hint : Segments FD and AD are the sides of triangle AFD. Segment AD is also a side of square ABCD.
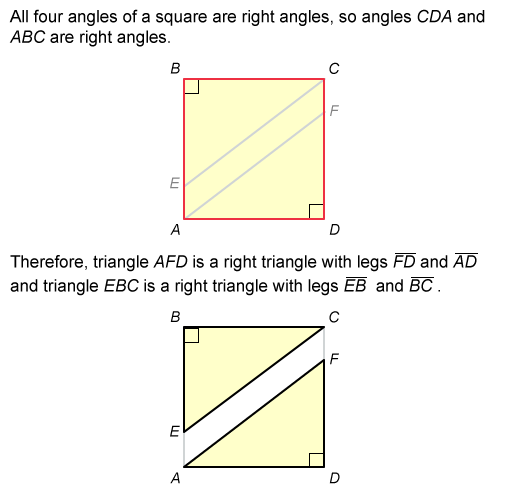
Notice that FD and AD are the legs of right triangle AFD, and that segment AD is also a side of square ABCD. Use the given area of square ABCD to find the length of AD.
The area of parallelogram AECF is also given. Use the given areas to find the area of triangle AFD, and then use the area of the triangle to find the length of FD.
length of AD.
The formula for the area of a square is A = s2, where s is the side length. It is given that the area of square ABCD is 144 ft2, so plug A = 144 into the formula and solve for s.
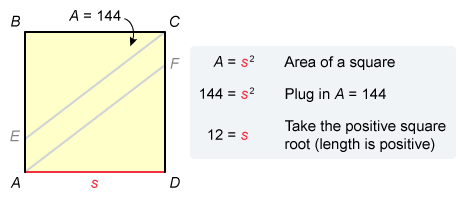
Square ABCD has side length s = 12, so the length of AD is 12 ft.
area of triangle AFD
The combined area of triangles AFD and CEB is equal to the area of square ABCD minus the area of parallelogram AECF.
The given area of square ABCD is 144 ft2 and that of parallelogram AECF is 36 ft2. Subtract to find that the combined the area of triangles ADF and CEB is 108 ft2.
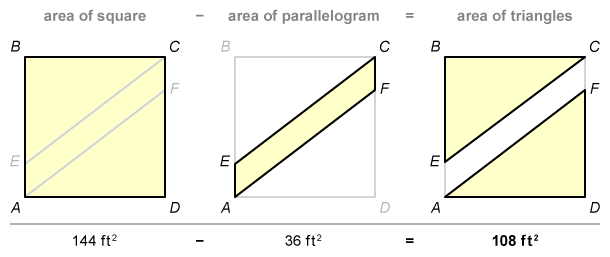
Triangles AFD and CEB are congruent (proof), so they have equal areas. Therefore, the area of triangle AFD is half of the combined area.
Divide 108 by 2 to find that the area of triangle AFD is 54 ft2.
Now use the length of AD (12) and the area of triangle AFD (54) to solve for the length of FD.
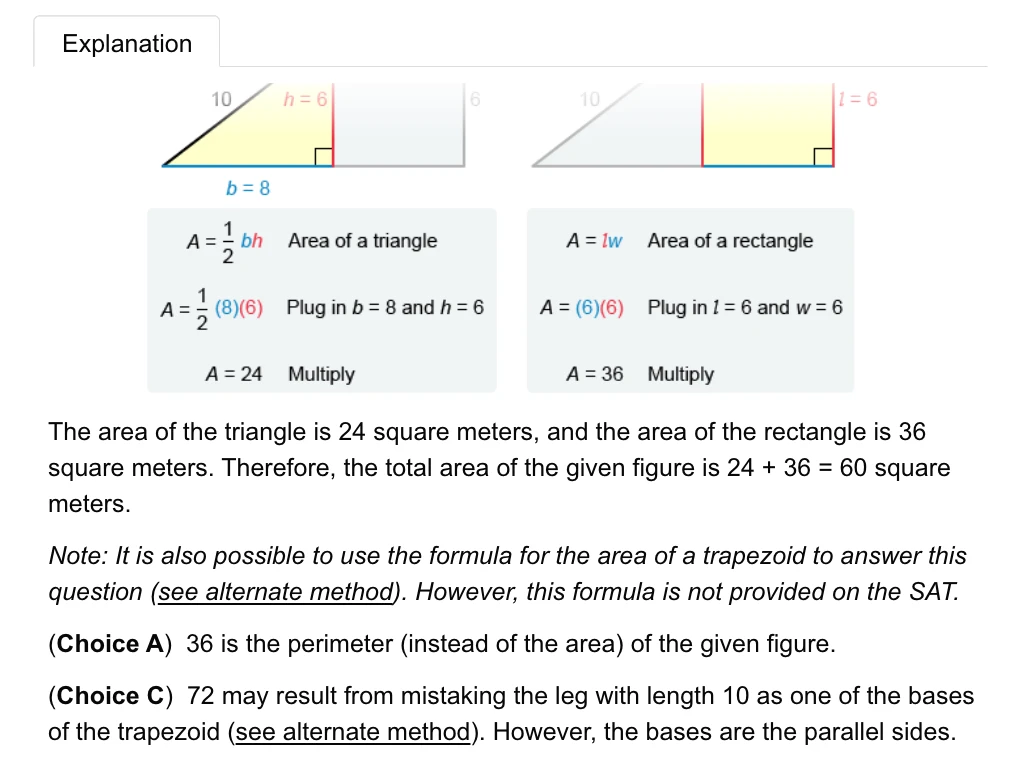
The formula for the area of a triangle is A = 1 / 2 bh , where b is the length of the base and h is the height. Let AD be the base and let FD be the height. Plug A = 54 and b = 12 into the area formula and solve for h.
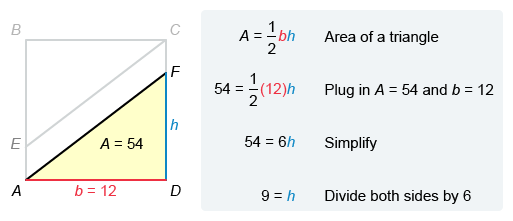
The value of h is 9, so the length of FD is 9.
(Choice A) 3 is the length of the shorter side of parallelogram AECF. This may result from mistakenly finding the length of FC (instead of FD).
(Choice C) 12 is the side length of square ABCD. This may result from mistaking the length of FD to be equal to the length of AD, but FD is not a side of square ABCD.
(Choice D) 15 is the length of the hypotenuse of triangle AFD. This may result from mistakenly finding the length of AD (instead of FD).
Things to remember:
- The formula for the area of a square is A = s2, where s is the side length.
- The formula for the area of a triangle is A = 1 / 2 bh, where b is the length of the base and h is the height.
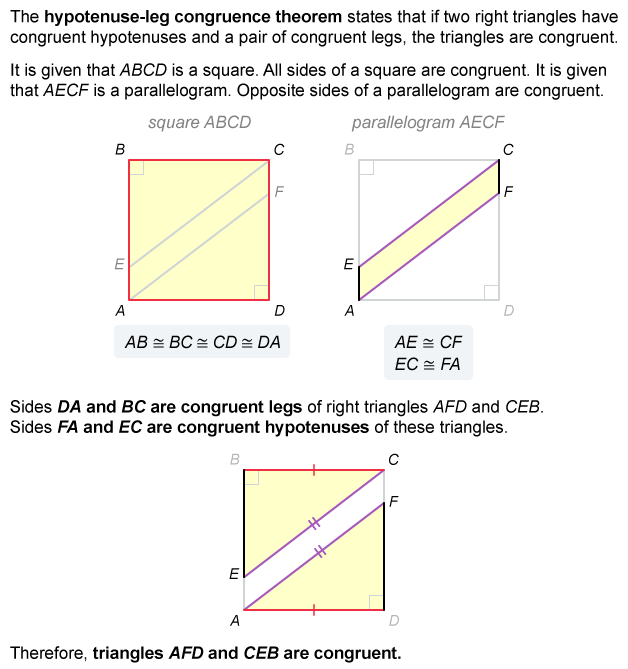
- If two right triangles have congruent hypotenuses and a pair of congruent legs, the triangles are congruent (hypotenuse-leg congruence theorem).
- If two triangles are congruent, they have equal areas.
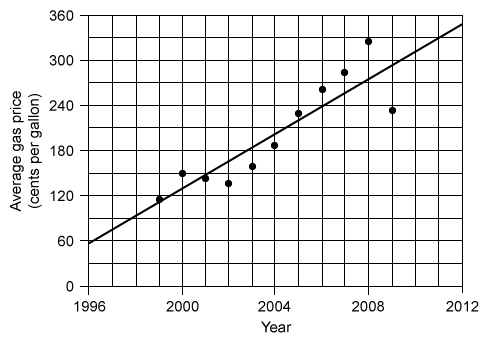
The scatterplot above shows the average gas price, in cents per gallon, in the United States during the years 1999 to 2009. A line of best fit is also shown. Which of the following is closest to the difference, in cents per gallon, between the average gas price in 2009 predicted by the given line of best fit and the actual average gas price in 2009?
- 31
- 62
- 124
- 210
Hint : The year is given on the x-axis (horizontal), and the average gas price in cents per gallon is given on the y-axis (vertical). Analyze each axis to determine the gridline increments.
The year is given on the x-axis (horizontal), and the average gas price in cents per gallon is given on the y-axis (vertical).
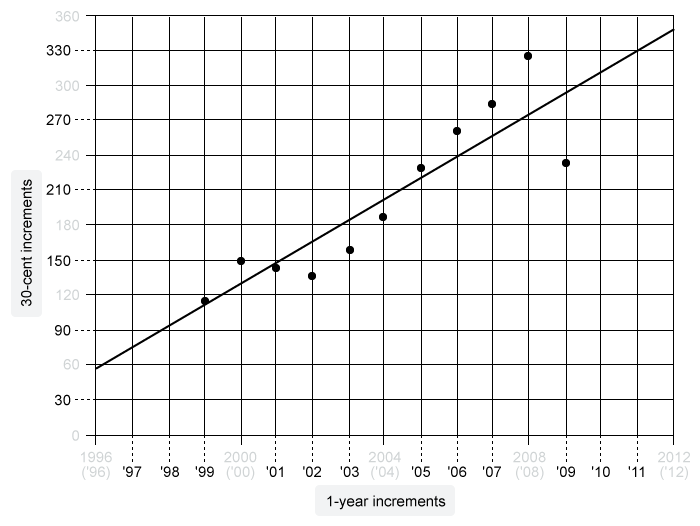
There are 4 gridlines for every x-axis label (multiples of 4), so each x-axis gridline is a 1-year increment.
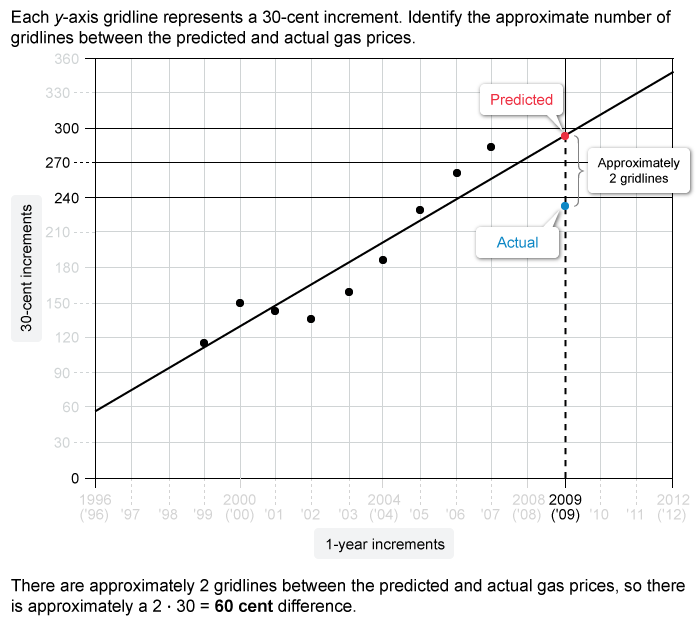
There are 2 gridlines for every y-axis label (multiples of 60), so each y-axis gridline is a 30-cent increment.
To find the difference between the predicted gas price and the actual gas price in 2009, identify and subtract the values of y of the line of best fit (predicted) and the data point (actual) at x = 2009.
The predicted gas price is approximately 300 cents, and the actual gas price is approximately 240 cents. Note: Each choice differs by a significant amount, so it is sufficient to approximate these values to the nearest gridline.
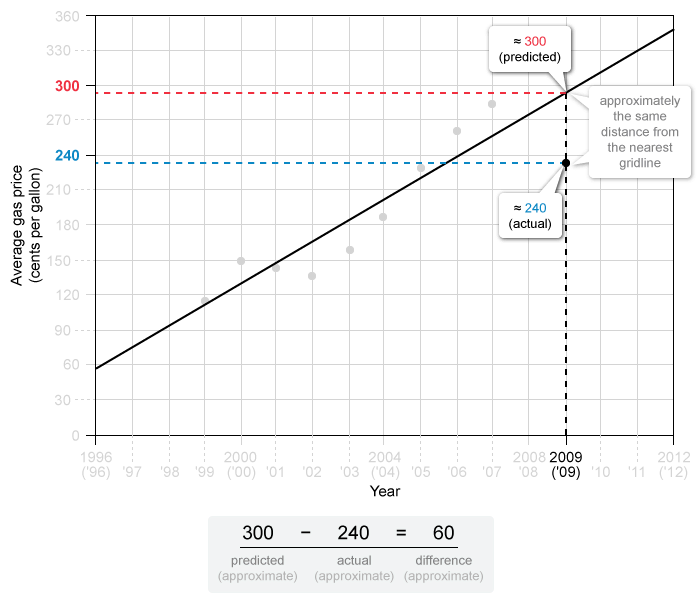
The difference, in cents per gallon, between the approximate predicted and actual gas price in 2009 is about 60. The answer choice closest to this difference is 62.
Note: It is possible to use the complete y-axis scale to estimate the number of gridlines between the line of best fit and a point to find the approximate distance (see how). This may be necessary for similar questions.
(Choices A and C) 31 and 124 may result from misinterpreting the scale of the y-axis. Each gridline on the y-axis represents a 30-cent increment.
(Choice D) 210 may result from approximating the difference between the highest and the lowest actual gas prices of all the years shown, but the question asks for the difference between the predicted and actual gas prices in 2009.
Things to remember:
- To analyze a particular variable on a scatterplot, first identify the axis (horizontal or vertical) that corresponds to that variable.
- To find the x– or y-value of a point on a scatterplot, first trace the point to the x– or y-axis. It may be necessary to use that axis scale to approximate the value, depending on the question.