Understanding your Digital SAT® score report may seem daunting at first, which is why we’ve simplified the process by breaking down all its components for easier interpretation. If you’ve taken the SAT® before, you’ll notice the College Board® introduced updates to the SAT score report. To help understand the differences, we’ll also provide a brief overview of the paper SAT score report to help you understand what has changed and what remains consistent.
What Is in Your SAT Score Report?
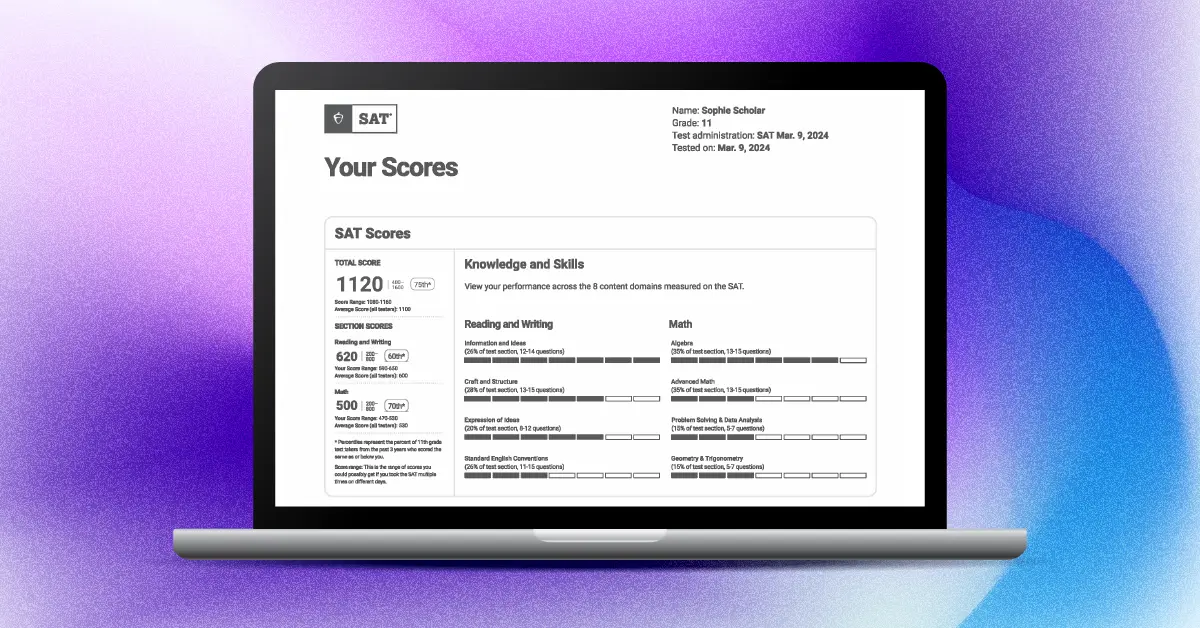
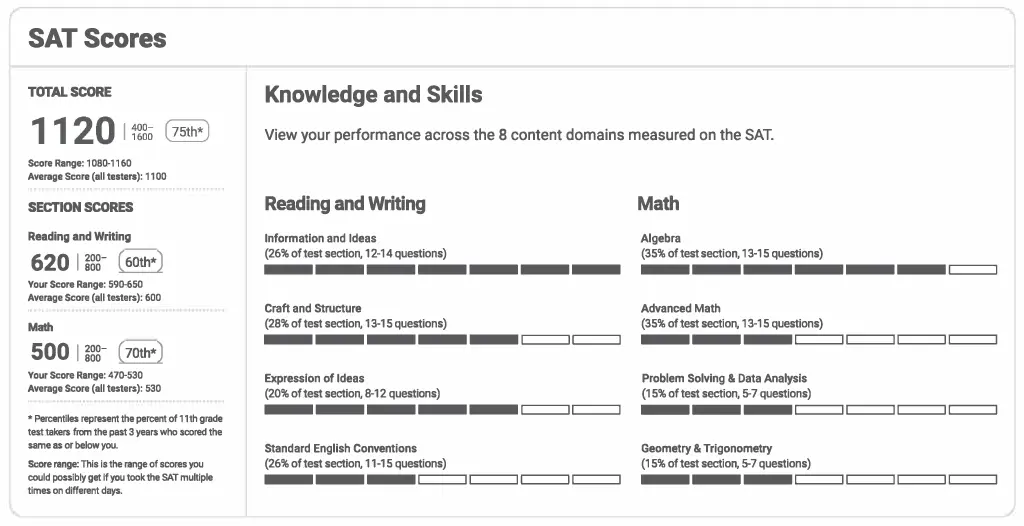
Your Digital SAT score report displays your total score, section scores, and an “All tester percentile” (User Percentile). Note that unlike the paper and pencil SAT, the subscores, cross-test scores, and college readiness benchmarks will not be part of your score report for the digital test.
The following table displays the score range for each component on the score report of the Digital SAT & the paper SAT to help you understand which components have changed and which ones haven’t.
| Digital SAT Score Report | Paper SAT Score Report | ||
|---|---|---|---|
| Score Type | Score Range | Score Type | Score Range |
| Total SAT score | 400 – 1600 | Total SAT score | 400 – 1600 |
| Section score | 200 – 800 | Section score | 200 – 800 |
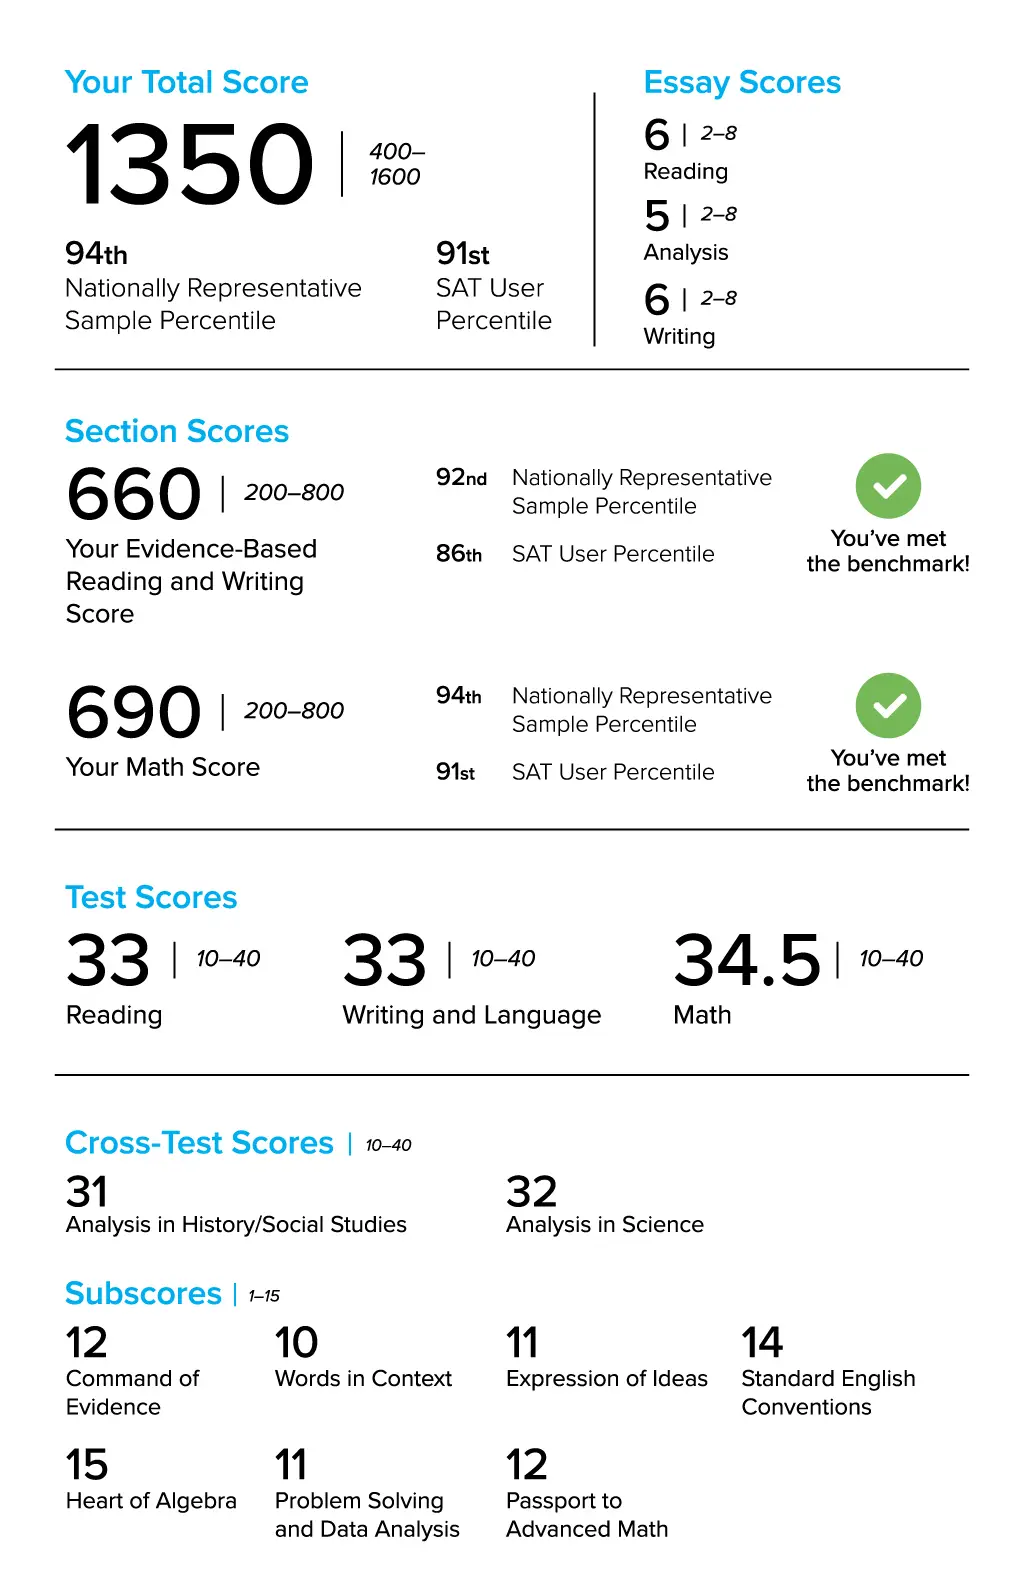
| Test score | N/A | Test score | 10 – 40 |
| Cross-test score | N/A | Cross-test score | 10 – 40 |
| Subscore | N/A | Subscore | 1 – 15 |
| Percentile | 1 – 99 | Percentile | 1 – 99 |
Total Score
Your Digital SAT score, often referred to as the total score or composite score, will be presented as a big black number on the top of your score report and ranges from 400-1600. When submitting your score to colleges, this is the score that is considered. In addition to your main score, you will also see your score percentile. This shows the percentage of students who scored lower than you on the test.
Section Scores
The section scores, ranging from 200-800, are divided into two sections: Reading and Writing (RW) and Math (M). As with your composite score, you will find your score percentile for each section.
On your Digital SAT score report, eight skill bars aligned to the major content groups covered in each section help you quickly see your strengths and knowledge gaps in each section. Each skill bar description provides the number of questions, their percentage of the section, and visual indicators corresponding to how well you did on that content type.
All Tester Percentiles (User Percentile)
The All Tester Percentile is determined by analyzing the scores achieved by students who took the SAT during high school in the last three graduating classes. It ranges from 1-99 and represents the percentage of students who score lower than you on the test. For example, if your SAT percentile for the total score is 86, it means that you scored better than 86% of the students who took the SAT. It does not mean that you scored exactly 86% on your test.
What’s No Longer Included in SAT Score Reports
The College Board has scrapped four types of scores. While they were included in the paper-and-pencil SAT score report, they will not be reported in the digital version of the test.
-
Test Score
Your “test scores,” ranging from 10-40, referred to the scores on your Reading, Writing and Language, and Math sections. Similar to “Section Scores,” these scores indicated how many questions you answered correctly or incorrectly on each test. -
Cross-Test Scores
In addition to Math and English, the SAT assesses your aptitude for social studies and science by including passages and problems related to these subjects. Previously, the SAT score report included two “cross-test” scores for Analysis in History/Social Studies and Analysis in Science. -
Subscores
Each of the following seven subscores on a scale of 1-15 reflected performance on:- Command of Evidence
- Words in Context
- Expression of Ideas
- Standard English Conventions
- Heart of Algebra
- Problem Solving and Data Analysis
- Passport to Advanced Math
-
Benchmark
The SAT score report used to include an icon indicating how prepared a student was for college-level courses, known as the benchmark. For example, the Evidence-Based Reading and Writing benchmark was 480, while the Math benchmark was 530.
Now that you know what is and isn’t on your Digital SAT score report, you might be curious to know how the SAT is scored. Read our SAT scoring guide to know everything about the SAT scoring system.
Know More About the SAT Score Report
What does it mean to self-report my SAT scores?
Many colleges allow students to self-report SAT scores by entering their scores directly on their admission application without submitting an official SAT score report initially. It’s important to note that if you are admitted and choose to enroll in a particular institution, you will likely be required to submit official score reports directly from the College Board for verification purposes.
How can I download my Digital SAT score report?
First, sign in to your College Board account. On the dashboard, click the arrow on the right side of your score report. You can download the score report by clicking the “Download Your Score Report” button in the top right corner.
How can the printed version of an SAT score report be certified?
Official score reports are sent electronically by the College Board and are considered certified documents. While you can download and print your SAT score report to keep for your reference, this printed report is not considered officially certified and will not be accepted by colleges.
How will the Digital SAT score report change for students and educators?
Students and educators receive Digital SAT score reports within days, rather than weeks of test day. The new Digital SAT score report includes score details plus information on potential career options based on student interests. This includes education level, potential salary ranges, and job availability in the student’s area.
If you’ve already tackled the SAT, don’t miss out on our insightful blog, What Is A Good And A Bad Digital SAT. It’s a valuable resource for gauging your performance and determining if you need to tweak your study strategy to achieve your desired score.
References
- Understanding Scores. (2023). Collegeboard.org. Retrieved February 7, 2024, from https://satsuite.collegeboard.org/media/pdf/digital-sat-understanding-scores.pdf
- Your Score Explained. (n.d.). Collegeboard.org. Retrieved February 7, 2024, from https://satsuite.collegeboard.org/sat/scores/understanding-scores/your-score-explained#:~:text=Next%20to%20your%20score%20are,score%20is%20your%20Score%20Range.