How To Write AP® Statistics Free-Response Questions (FRQs)

This guide will discuss key strategies and how to write AP Stats FRQ section of the AP® Statistics exam.
Visual representation and definition of a random sampling

Format of the AP Statistics FRQ section

The FRQ section represents 50% of the composite score on the AP Statistics exam. It also represents 50% of the total time spent on the AP Statistics exam. The FRQ section is split into two parts. The question types, the skills they require you to apply, and the units from which these questions appear are listed below.

Question type Units Covered Skills Assessed
One multi-part question primarily focuses on collecting data Unit 3 Selecting Methods
One multi-part question primarily focuses on exploring data Units 1 and 2 Data Analysis
One multipart question, primarily on probability and sampling distributions Units 4 and 5
One question with a primary focus on inference Units 6 - 9 Statistical Argumentation
One question on two or more skill categories Multiple Skills Assessed

The second part of the FRQ, Part B, is the investigative task. The purpose of the investigative task is to assess multiple skill categories and content areas, focusing on the application of skills and content in new contexts or in non-routine ways. It is common for the investigative task to include hypothesis tests and other material that would not be included as part of the AP Statistics course but which can be understood by applying the concepts learned in the course.

At least three questions from Part A, as well as the investigative task in Part B, will assess statistical argumentation.

How To Answer AP Statistics FRQs?

Unlike multiple-choice questions, AP Stats FRQ responses require you to show your work and sometimes create graphs. They are scored by AP readers based on the accuracy of methods and completeness of explanations.

FRQs are scored in two steps:

  1. Each part is rated as correct, partially correct, or incorrect.
  2. Each part is given a score between 0 and 4 points, with full credit requiring correctness in all sections.

What does this mean for how you should write free-response questions? Several strategies are important.

  • Strategy 1: Explain your answer in detail, but be concise with individual points

    To earn full credit, your response must meet multiple criteria based on the question’s intention. Be detailed and accurate, but avoid spending too much time on one component.

    For example, when describing a distribution, cover criteria like (1) center, (2) spread, (3) shape, and (4) unusual features. A four-sentence answer addressing each correctly will earn full credit, while focusing too much on one aspect, like 'center,' will result in a lower score.

  • Strategy 2: Keep an eye on the clock

    Time management is crucial for the AP Stats exam. For Part A of the FRQ section, aim to spend 10-12 minutes per question. Leave time to check answers and focus on more difficult ones. Part B gives you 25 minutes, with 4-5 minutes per sub-question. If a part is taking too long or you're unsure, it’s okay to skip it and move on. Missing some points is fine if it helps you score better on others. This is an essential strategy when planning how to write AP Stats FRQ answers effectively.

  • Strategy 3: Use key terms you learned in class and use proper units

    The criteria that you need to fulfill in an FRQ answer are often directly related to the key terms you learned in class. Using those terms makes it easier for an AP reader to recognize that you are meeting those criteria.

    An important example is the units you use to refer to any statistical data. A common criterion that AP readers look for in answers is that the answer properly refers to the context of the question, and the use of proper units in your answer is important.

  • Strategy 4: Answer each part of multi-part questions in order

    The parts of a multi-part question on the AP Stats exam often build on one another. Even when the exam does not explicitly state it, the answers to previous parts can often be used to solve later parts. For this reason, try to answer multi-part questions in the order they are presented. This may not always be possible or practical, but it should be your default strategy.

  • Strategy 5: Decide beforehand when you want to do Part B (the investigative task)

    The last FRQ, the investigative task in Part B, is worth more than the other FRQs. Consider starting it before finishing Part A if you prefer tackling difficult questions first. This can help with time management. However, don't exceed the 25-minute limit for Part B by more than a few minutes. If you're stuck, move back to Part A after addressing most of Part B.

AP Stats is hard. We can help.
Practice tough problems and make them easy.
Visual of AP Statistics question bank displaying exam-level questions & detailed explanations on laptop, tablet, and mobile phone.

AP Statistics FRQ Examples

We will now go over some examples of AP Stats FRQ questions from the 2019 exam to give you an idea of what to expect. However, note the College Board® provides all this information on its website, and we have only compiled them here for quick reference.

We have explained each example with two types of answers that can earn you full credit. An essentially correct answer includes a complete answer with all the components of the question correctly addressed. As a reference, we have also added the ideal solution provided by AP to help you understand the answering criteria put forward by the College Board. You can compare the two answer categories to identify the components for AP Stats FRQs.

Present all of your work. You will be graded on the accuracy and completeness of your results and explanations, as well as the correctness of your techniques, so make sure to indicate these clearly.

Part A - Question 1 (a)

The sizes, in square feet, of the 20 rooms in a student residence hall at a certain university are summarized in the following histogram.

Bar graph representing Room size on X-axis and Number of rooms on Y-axis
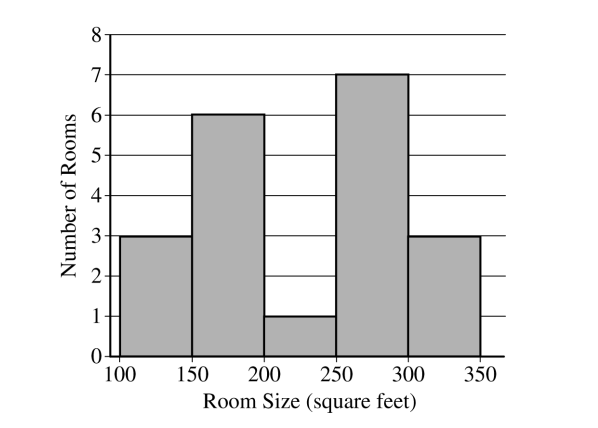
  1. Based on the histogram, write a few sentences describing the distribution of room size in the residence hall.

Explanation:

For the sake of ease, we are considering only the first sub-part of Question 1. While solving a question like this, below are a few pointers that will help you:

The intent of this Question

Test your ability to describe features of a distribution using a histogram.

Essentially Correct Answer Includes

An answer to this part of Question 1 is considered "Essentially Correct" if it includes each of these four components detailed by AP.

  1. The shape is bimodal, OR there are two peaks, OR there are two clusters.
  2. The center is between 200 and 300 square feet.
  3. The spread is addressed by stating the range, which is a value between 150 and 250 square feet, OR the interquartile range is a value between 50 and 150 square feet, OR all room sizes are between 100 and 350 square feet.

    The response includes context.

Ideal Solution provided by AP

The distribution of the sample of room sizes is bimodal and roughly symmetric, with most room sizes falling into two clusters: 100 to 200 square feet and 250 to 350 square feet. The center of the distribution is between 200 and 300 square feet. The range of the distribution is between 150 and 250 square feet. There are no apparent outliers.

*Source: Refer to question 1 of Part A of the 2019 released items from the CollegeBoard Released FRQs

Part B - Investigative Task: Question 6 (a - c)

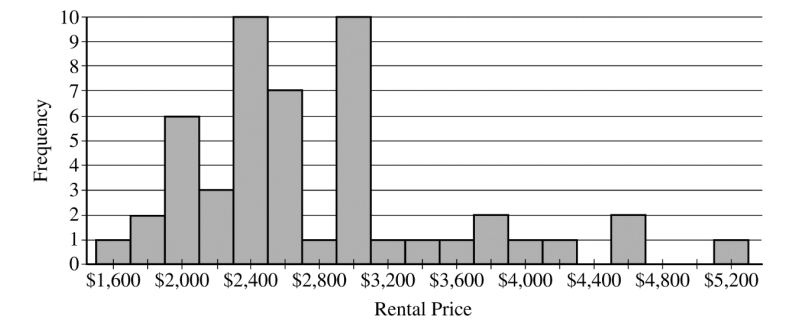
Emma is moving to a large city and is investigating the typical monthly rental prices of available one-bedroom apartments. She obtained a random sample of rental prices for 50 one-bedroom apartments taken from a website where people voluntarily list available apartments.

  1. Describe the population for which it is appropriate for Emma to generalize the results from her sample. The distribution of the 50 rental prices of the available apartments is shown in the following histogram.

    A bar graph representing Rental price of apartment on X-axis & Frequency on Y-axis
  2. Emma wants to estimate the typical rental price of a one-bedroom apartment in the city. Based on the distribution shown, what is a disadvantage of using the mean rather than the median as an estimate of the typical rental price?
  3. Instead of using the sample median as the point estimate for the population median, Emma wants to use an interval estimate. However, computing an interval estimate requires knowing the sampling distribution of the sample median for samples of size 50. Emma has one point, her sample median, in that sampling distribution. Using information about rental prices that are available on the Web site, describe how someone could develop a theoretical sampling distribution of the sample median for samples of size 50.

Explanation:

The intent of this Question

  • For (a): Recognize the population to which results from a random sample may be generalized. 
  • For (b): Describe a disadvantage of using a sample mean rather than a sample median to indicate typical values when the sample distribution is skewed.
  • For (c): Describe how the theoretical sampling distribution of the sample median could be constructed.

Essentially Correct Answer Includes

For Parts (a) and (b), the answers are collectively considered “essentially correct” if they include each of these three components detailed by AP.

  1. In part (a), the correct population (listings of one-bedroom apartments on the website) is identified.
  2. In part (b), identifying that using the sample mean instead of the sample median overestimates the typical rental price. The disadvantage of using the sample mean that is reported in part (b) is correctly linked to some feature of the distribution (e.g. skewness) that is evident in the histogram.
  3. For part (c), the answer is considered "essentially correct" if it includes both of these components detailed by AP.

    1. Indicates that Emma would need to obtain every possible sample of 50 one-bedroom apartments.
    2. Indicates that Emma would need to compute the median rental price for each sample.

Ideal Solution provided by AP

  1. Part (a): Because random sampling was used, the results of the sample may be generalized to the population of rental prices for one-bedroom apartments in the city that are listed on this particular website at the time the sample was taken.
  2. Part (b): Because the distribution of the 50 rental prices in the sample is skewed to the right, the sample median provides a better indicator of typical rental prices than the sample mean. Some very large rental prices result in a sample mean that is substantially larger than the more typical rental prices. As a result, the sample mean would overestimate the typical rental price, whereas the sample median would be a more accurate representation of typical rental prices.
  3. Part (c): To determine the sampling distribution of median rental prices for random samples of 50 one-bedroom apartments from this population, Emma would need to obtain every possible sample of 50 one-bedroom apartments from this website and compute the median of each sample. The collection of all possible sample medians is the theoretical sampling distribution for sample median.

*Source: Refer to question 6 of Part B of the 2019 released items from the CollegeBoard Released FRQs

How Can I Practice AP Statistics Free-Response Questions?

The most effective way to practice AP Statistics free-response questions is by using the FRQ sections from past exams. Focus on managing your time within the allotted period. After completing a practice run, grade your answers using the scoring guidelines provided by the College Board. Regular AP Stats practice FRQ sessions will help you improve both accuracy and time management.

Frequently Asked Questions (FAQ)

There are five free-response questions included in Part A and one free-response question included in Part B. However, several FRQs contain multiple parts.

The FRQ section constitutes 50% of the AP Statistics exam. The FRQs are graded by AP readers based on the correctness of the methods as well as the accuracy and completeness of the results and explanations.

The total time allotted for the FRQ section of the AP Statistics is 90 minutes, split between Part A (65 minutes) and Part B (25 minutes).

The College Board releases past exam questions where you can download FRQs from. In addition, you can download scoring guidelines, sample responses from exam takers, and score distributions.

A’s and 5’s in AP Stats Without the Struggle!
Our interactive AP Statistics course makes hard topics easy, so you excel with less stress.
Visual of AP Statistics prep course product suite showing streamlined study materials designed for fast success.

References

Read More About the AP Statistics Exam

How to Approach for AP Statistics MCQ

Having difficulty keeping up with AP Statistics MCQs? Check out our comprehensive guide with some tips for mastering each question type in the multiple-choice section.

How to Study for AP Statistics

Are you looking for some pro tips and ultimate resources to study AP Statistics? Click here for a step-by-step expert’s guide to help you get a 5 in AP Stats with ease.

AP Statistics Exam Format

Looking for an easy-to-read AP Stats exam format? Discover the exam format in this simple guide that breaks down the exam components, question types, and more!

Best AP Statistics Study Guide Comparison

Discover expert insights into Kaplan, Barron's, Princeton Review, and UWorld. Learn how each resource compares to help you choose the best fit.

Best AP Statistics Prep Course Review

Wondering which AP Statistics prep course is the best? Check out this detailed review to find the right course for your exam prep.

How to Self-Study for AP Statistics

Learn how to self-study for AP Statistics like a pro! Follow this comprehensive plan filled with tips, tools, and resources for success.

View More...
Scroll to Top