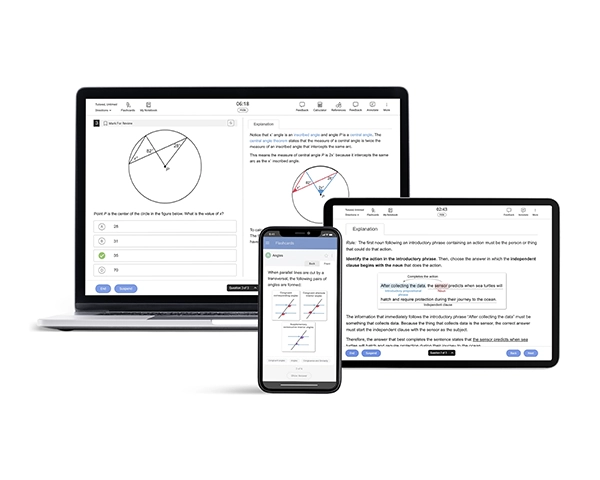
Let’s review your fictional SAT® score report. We’ll break down every number, percentile, and even those tricky domain bars. When you’re done, you’ll understand what colleges care about, how to read the tricky parts, and the next steps and resources you need to improve.
SAT Score Report: Table of Contents
- 3 Most Important SAT Score Report Numbers
- Score Range
- Average Score (All Testers)
- What’s a Good vs Great Score
- All Tester Percentile
- Knowledge and Skills
- Content Domains
- Career Insights Snapshot
- Additional SAT Insights
- Predicting Other Exam Scores
- SAT Benchmark and College/Career Readiness
- How to Get Your SAT Score Report
- SAT Score Report and Super Scoring / Score Choice
- How to Use Your Score Report to Improve (Resources)
- Frequently Asked Questions (FAQs)
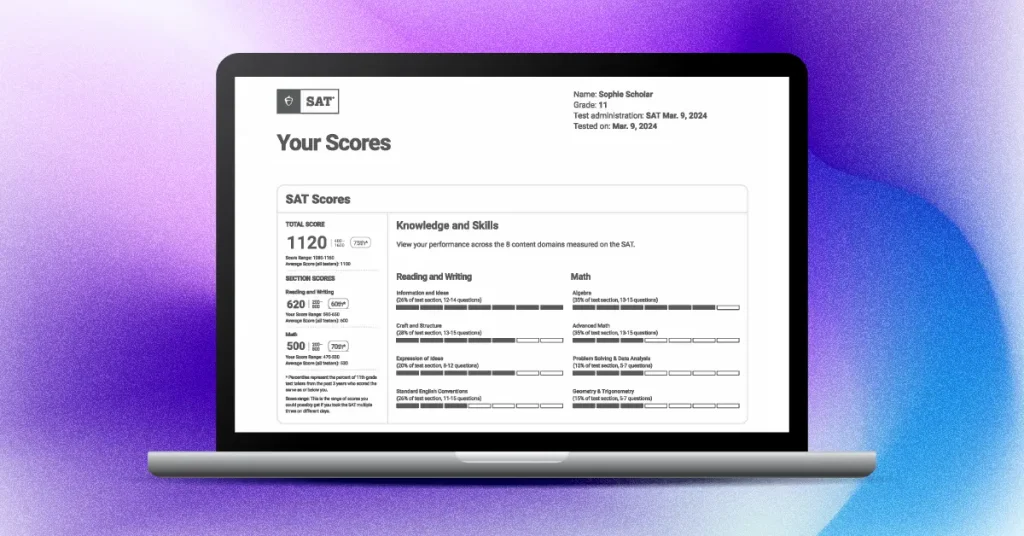
3 Most Important SAT Score Report Numbers, Including Total Score
Source: College Board®
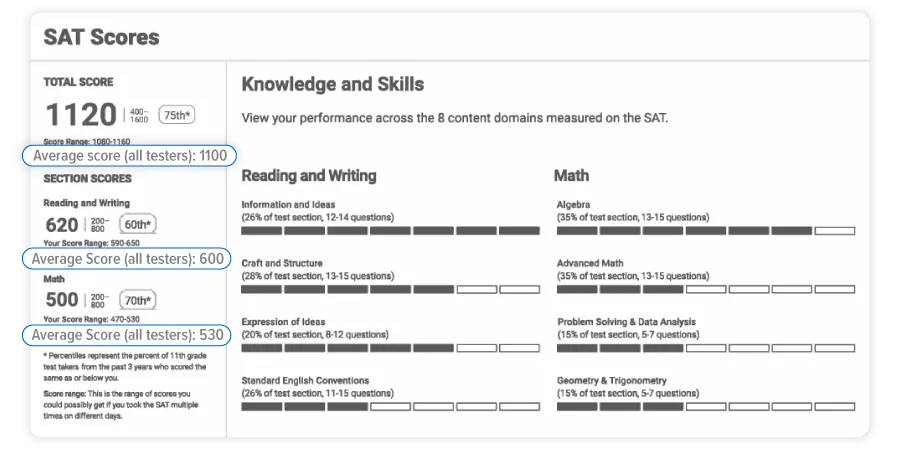
You’ll see your Total Scores at the top, with your Section Scores (Reading and Writing (R&W) and Math) below.
Your total score is the sum of your section scores. In this example:
- R&W: 620
- Math: 500
- Total: 1120 (620 + 500)
Why it matters: Compare each section to your goals or the ranges at your target schools. This will give you a snapshot of where you are right now. Learn more about how these scores impact college admissions.
Score Range
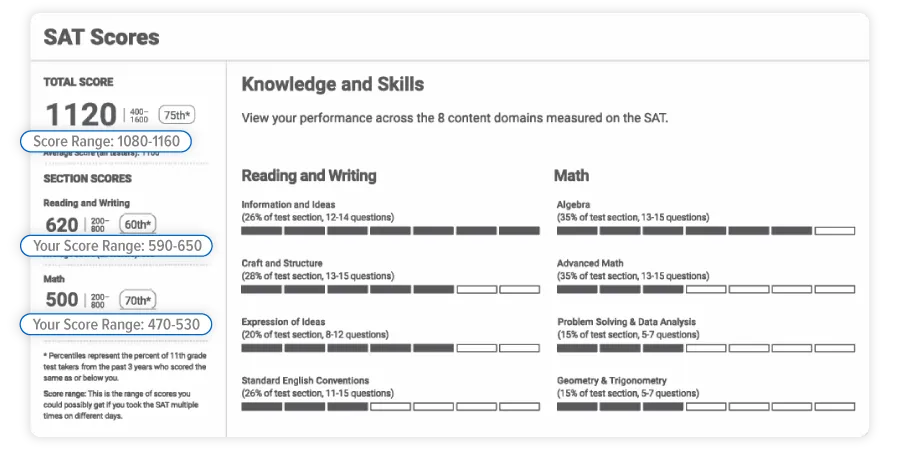
Source: College Board
Your score range represents where your score would likely fall if you retook the SAT under the same conditions and with similar preparation.
Example: If your Math score is 500 and your score range is 470–530, your official score is 500, but on another test day, you could reasonably land anywhere between 470 and 530.
Why does this happen? Small test-day factors can shift results, even if your skill level stays the same:
- You might get a slightly different mix of questions.
- You could pace yourself differently across sections.
- Your focus, energy, or nerves may change a little.
Why it matters:
- A small change (500 → 510) is normal and doesn’t necessarily mean you’ve improved or declined.
- Real progress shows when you move outside your earlier range (e.g., 500 → 560).
- Colleges record your official score, not the range—it simply shows normal variability.
Takeaway: Don’t stress over minor fluctuations. Your score range helps you focus on meaningful growth. Aim to move into a higher range next time.
Average Score (All Testers)
Source: College Board
The Average Score (All Testers) compares your total and section scores to the average scores of all SAT exam takers over the past three years, regardless of grade level.
Example: In our example score report, the average total score for all testers is 1100. Your total score is 1120, which is 20 points above the average.
Why it matters: The average score provides context for how you performed compared to other students worldwide. However, colleges don’t use this number directly—they compare your scores to those of their own admitted students.
What’s a “Good” vs. “Great” Score?
The "average" score (around 1003) is just one data point. A "good" score depends entirely on your personal goals. Here’s a general guide:
- Good (Community College / Less Selective State Schools): A score in the 950-1100 range often meets the requirements for many state universities and local colleges.
- Very Good (State Universities / Selective Public Schools): Scores from 1100-1300 make you a competitive applicant for flagship state universities and many private colleges.
- Great (Competitive / Ivy League Schools): To be a strong candidate for highly selective schools, students are typically aiming for 1350 or higher, with scores often in the 1450-1600 range for the most elite institutions.
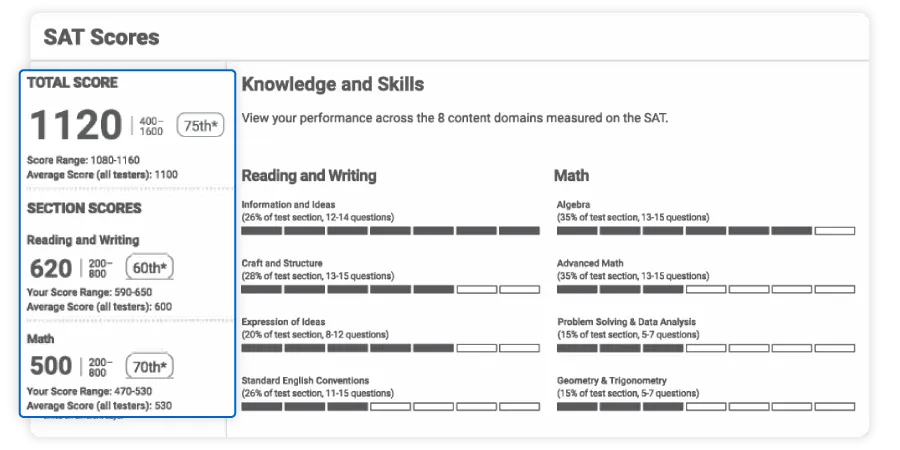
All Tester Percentiles
Source: College Board
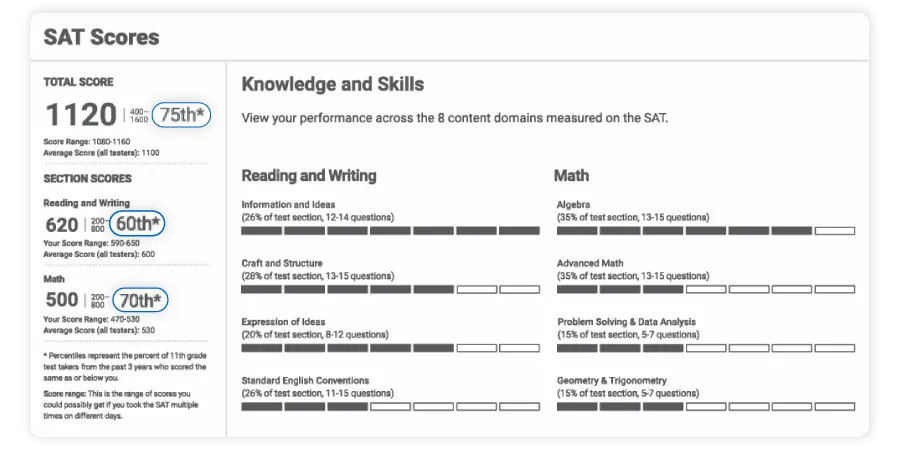
The All Tester Percentiles compare your score to 12th-grade SAT Exam takers from the last 3 years worldwide (both SAT Weekend and SAT School Day).
Example: If it says 75th, you scored at or above 75% of SAT takers in the last 3 years. It does not mean you got 75% of the questions right.
Why it matters: This number helps you understand where you stand among your peers, and not to measure your exam performance.
Knowledge and Skills Performance
Source: College Board
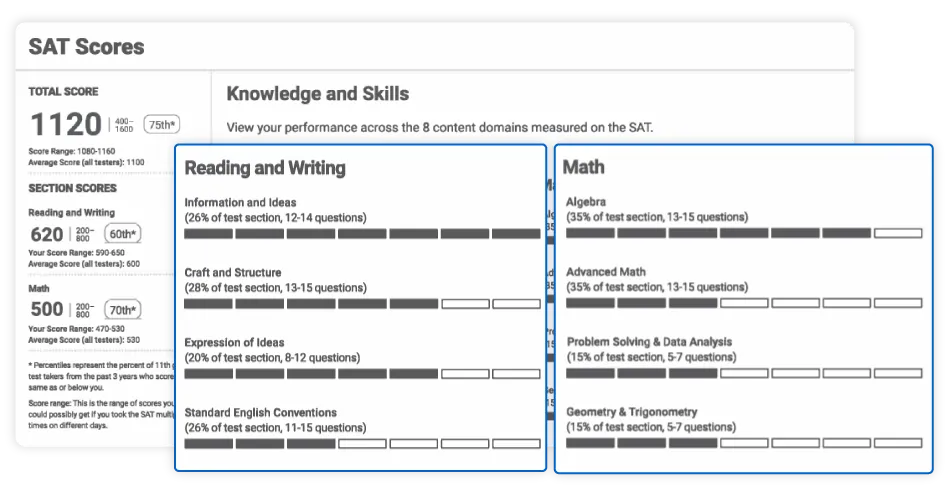
The Knowledge and Skills section on the right shows a progress bar for each of the 8 content domains the SAT Exam measures. The filled part of a bar shows your level of mastery in that domain it is not your section score.
Picture each section as a pizza. Each content domain is a slice (the % and question count). The bar is how much of that slice you “ate” on test day.
Visualize:
- Bigger % of the test section = more important
- Longer bar = stronger performance
Example: Information and Ideas (R&W):
Your example report shows Information and Ideas with a full bar, 26% of the test section, and 12–14 questions, which means this skill appears a lot in R&W, comprising just over a quarter of the section.
You performed strongly on it, and that strong performance likely lifted your R&W score more than a full bar on Expression of Ideas (~20% of the test section) would have, for example.
In short:
- Good: Big slice (test section %) + long bar → major boost to your section score
- Bad: Big slice (test section %) + short bar → major drag on your section score
- “Meh”: Small slice (test section %) + any bar → smaller impact (good or bad)
How to Diagnose a Weakness: High-achieving students use this section to solve the test. Look for a “Big slice + short bar” insight. For example, if your “Algebra” bar is one of the shortest, but it makes up a large percentage (a big slice) of the Math section, you’ve found your highest-priority problem. This tells you to stop just taking full practice tests and instead drill specific UWorld or Khan Academy Algebra modules until that weakness becomes a strength.
Online extra:
- The scores portal in your College Board dashboard lets you explore each domain in more detail, and you can view skills and example questions for the next performance band (Skills Insight).
Content Domains Performance
Source: College Board
SAT Score Report Content Domains are the skill groups that make up each section. The percentage and question count tell you how often the skill shows up; the bar tells you how well you did on it this test (see Knowledge and Skills section). This information will help you target what to focus on should you retake the SAT Exam.
Reading and Writing
- Information and Ideas: Find main ideas, use evidence, and read tables/graphs.
- Craft and Structure: This includes words in context, how a passage is built, tone, and connections across texts.
- Expression of Ideas: Revise for clarity, organization, and purpose.
- Standard English Conventions: This covers grammar, usage, and punctuation.
Math
- Algebra: This cover linear equations/inequalities, functions, and systems.
- Advanced Math: This covers nonlinear equations/functions (quadratic, exponential, polynomial, rational, radical).
- Problem-Solving and Data Analysis: This includes ratios/rates/percentages, reading data, basic statistics, and probability.
- Geometry and Trigonometry: This covers area/volume, lines/angles/triangles, right-triangle trig, and circles.
Career Insights Snapshot
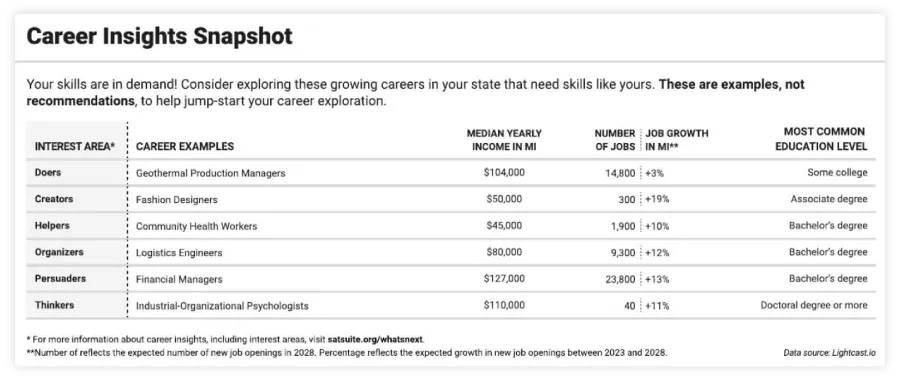
The Career Insights Snapshot below your SAT Score Report (for U.S. and DoDEA schools) shows growing careers in your state related to your scores.
What you’ll see:
- Job titles in growing fields
- A few facts for each (typical education level, median yearly income, expected job growth in your state)
Example: You might see roles like Graphic Designer or Mechanical Engineer listed with the education most people have for that job, what they typically earn, and how fast openings are growing where you live. It’s there to spark ideas not to tell you what to do.
Why it matters:
- Gives you early, low-pressure ideas to explore
- Helps you connect classes and activities to real careers
- Assists you when talking with counselors, teachers, and families about next steps
How to use it:
- Star or mark anything that looks interesting.
- Note the education level (certificate, 2-year, 4-year) to plan courses.
- Look up more details on College Board’s online portal/BigFuture.
Additional SAT Insights
You can open the Additional SAT Insights dashboard if you’re 13+ and have a College Board account. It gives you more context than your Score Report and points you to specific next steps. These insights are for you (and your counselor). Colleges still see the scores you send, not your comparisons or practice data.
What you’ll see
- Score comparisons: your total and section scores versus your school, district, state, and all testers (last 3 years)
- More percentiles: country, state, and all testers percentiles (built from the past 3 cohorts)
- Benchmarks: clear met / not met for Reading & Writing and Math, with links to what to work on
- Score range info: reminders that small swings are normal, plus an explainer
- Deeper skill detail: your 8 domains across 7 performance bands, with skills insight examples for the next band up
- Career exploration: links to BigFuture, a short career quiz, and free planning tools
- Next steps: Quick links to official SAT prep on Khan Academy, SAT suite information, and college planning resources.
Why it matters:
- Puts your score in context (school/district/state/world)
- Shows exactly where to focus using benchmarks and domain bands
- Gives you examples of the skills to build next, not just labels
Predicting Other Exam Scores
A simple way to read your scores across the SAT suite: All tests (PSAT 8/9, PSAT 10/PSAT/NMSQT, SAT Exam) use the same scale for total and section scores (SAT total range 400–1600). A given section score means the same level of achievement across all of them.
Example
- If you earn 500 in Math on the SAT, you’d be expected to earn about 500 in Math on the PSAT taken that same day same skill level, same scale.
- If you scored 500 on last year’s PSAT Math and 550 on this year’s SAT Math, that’s +50 points of growth.
Why it matters:
- Lets you track real growth year to year without conversions
- Helps you set goals (e.g., “add +40 in Math”)
- Makes practice scores across PSAT/SAT directly comparable
How to use it (quick):
- Treat your latest PSAT section scores as your starting point for SAT goals.
- Aim for a specific point gain (not tiny day-to-day swings).
- Remember: the “same score = same level” idea assumes same-day conditions; actual test days can vary slightly.
What is the SAT Benchmark? College and Career Readiness
These section-level target scores predict about a 75% chance you’ll earn a C or better in related first-semester, credit-bearing college classes.
The benchmark numbers (section level):
- Reading and Writing: 480
- Math: 530
How to read them:
- At or above the benchmark → You’re on track for college-level work in that section.
- Below the benchmark → You’re close but not there yet; it’s a nudge to build skills in that section.
Why this matters: Benchmarks give you (and your counselor/teachers) a quick, simple signal of readiness. They’re guidance, and not a label, nor the same as an admissions cutoff. Colleges look at your actual section scores and their ranges.
How to Get Your SAT Score Report
- Sign in to your College Board account (if you’re 13+).
- Click View Scores, then choose your SAT Exam test date.
- Click Download “Your Scores” this PDF is your official SAT Score Report.
- If you’re under 13 (or prefer school help), ask your counselor or teacher to open and share your Your Scores PDF from the K–12 score reporting portal.
- If scores aren’t posted yet, your account will show the release date; once live, the online portal includes extra insights you won’t see on the PDF.
How Your SAT Score Report Impacts Superscoring and Score Choice
This score report is more than just a summary; it's a tool for your admissions strategy. Here’s how it fits into the bigger picture:
- Superscoring: Most colleges allow you to "superscore," meaning they take your highest Math score and your highest Reading/Writing score even if they come from different test dates. Look at your section scores (e.g., 700 Math, 650 R/W). If you test again and get a 680 Math but a 700 R/W, a college that superscores would combine your 700 Math (from Test 1) and your 700 R/W (from Test 2) for a 1400 superscore.
- Score Choice: "Score Choice" is a policy that lets you choose which test dates you send to a college. If you had a terrible test day and you know this report is an outlier, you can often choose not to send it. This score report helps you decide which "set" of scores best represents your abilities. (Always check the policy for each college you're applying to!)
How to Use Your Score Report to Improve
Take a breath one score doesn’t define you. Check your score range, review the Knowledge and Skills section, and focus on the big domains with short bars. Check out how UWorld can help you do this with targeted digital drills, step-by-step explanations, timers, and analytics.
Here are some additional resources to boost your score and morale:
Big score goals
- How to Get a 1600 on the SAT
- Increase Your Chance of Score Improvement
- Improve Your SAT Score in 1 Month: 5 Steps
Section-specific help
- Tips to Improve SAT Math Scores
- Strategies to Get a Perfect SAT Reading Score
- Improve Your SAT Writing Score
- Boost Performance with Reading Practice Tests
- Get the Most Out of SAT Math Practice Questions
Study plans and classes
Motivation
Frequently Asked Questions (FAQs)
What parts of my SAT Score Report do colleges see?
How do I send my Score Report to Colleges?
How do I download my SAT Score Report on a smartphone?
On iPhone (Safari), sign in, tap “View Scores,” and open your SAT date. Then tap share and “Save to Files.” If you don’t see a download, choose Print, pinch out to make a PDF, tap Share, then “Save to Files.”
On Android (Chrome), sign in, tap “View Scores,” and open your SAT date. Then tap the 3 dots and Download. If needed, choose Share, then Print, and select “Save as PDF.”How do I save my SAT Score Report as a PDF?
My SAT Score Report says “Score Sends Held.” What does that mean?
My score moved 10–20 points. Did I get worse?
My percentile looks low. Am I in trouble?
References
- College Board. “Understanding Scores.” https://satsuite.collegeboard.org/media/pdf/sat-understanding-scores.pdf
- College Board. “Scores and reporting (students).” https://satsuite.collegeboard.org/sat/help-center/students/scores-reporting
- College Board. “Student Scores.” https://studentscores.collegeboard.org/home