Are you taking the AP Statistics exam and are wondering how it is scored? Well, we’ve got your back! By the end of this article, you will have a clear idea of whether AP Stats could be the right choice for you. Keep reading!
How Does Scoring Work on the AP Statistics Test?
The AP Statistics Exam is scored on a scale of 1 to 5, with each score reflecting a specific level of achievement. The scoring process involves both multiple-choice questions (MCQs) and free-response questions (FRQs).
The following table shows how the composite score is distributed across the 2 sections:
| Type of Questions | Points |
|---|---|
| Section I: 40 Multiple-choice Questions | 50 points |
| Section II: 6 Free-Response Questions | 50 points |
| Subtotal | 100 points |
As you can see from the table above, the 50 points in the MCQ section are distributed across 40 questions. Roughly, each correct answer carries 1 point. Now, are you penalized for guessing on the AP Statistics exam? NO! The exam does not penalize you for wrong answers, so never leave a question blank, even if you are unsure of the correct answer.
In Section II, each question carries roughly 4 points, totaling 50 points for six questions. These questions are graded holistically. This means your grade is awarded based on the overall quality of your answer and not on the small bits of correct information or formulas you present on the answer sheet. The College Board® has developed the following grading rubric for each free-response question:
- 4: Complete Response: Demonstrates a thorough understanding of the statistical components of the problem.
- 3: Substantial Response: Although there may be arithmetic errors, the answers are still reasonable and demonstrate a thorough understanding of the problem's statistical components.
- 2: Developing Response: This may contain errors that result in some illogical answers, but it demonstrates some understanding of the problem's statistical components.
- 1: Minimal Response: Misapplies or fails to apply appropriate statistical techniques and demonstrates a limited understanding of statistical components by failing to identify important components
- 0: No Response: This demonstrates a lack of understanding of statistical components and also applies if the question is not attempted at all.
This grading rubric implies that if you only include a few correct equations or arithmetic answers, you won't earn many points. To get a good score on these questions, you must demonstrate that you understand how to use statistics.
AP Statistics Raw Score Conversion
Once your total points from each section are calculated, they are added to present your final composite score which is then converted into the AP scaled score, ranging from 1 to 5. The raw score conversion process is kept confidential by the College Board. Your composite score on the AP Exam is never presented publicly. You only get the AP Exam grade (1-5) which is calculated after processing your composite raw score on your AP mark sheet.
AP Statistics Scoring Table
After your AP Statistics exam scores are recorded on the AP grading scale, they are sent to the colleges you’ve selected. To learn how to have the College Board send your AP scores to your college, visit our page on AP Exam Scores.
Although each college has its own criteria for granting credit and/or placement based on AP scores, most colleges follow a standard formula for converting your AP Stats score into the equivalent college grade. Below is the AP score table showing the conversion of AP scores into equivalent college grades for the Stats exam:
| AP Score | College Grade Equivalent | Qualification |
|---|---|---|
| 5 | A+ or A | Extremely well qualified |
| 4 | A-, B+, or B | Very well qualified |
| 3 | B-, C+, or C | Qualified |
| 2 | — | Possibly Qualified |
| 1 | — | No recommendation |
As shown in the table, colleges generally do not consider scores below 3 for admissions purposes. Therefore, aim for a score of 3 or higher if you're hoping to earn college credit or Advanced Placement for your AP Stats exam score. However, always check with the colleges you're applying to for their specific minimum requirements.
AP Statistics Score Distributions
AP Stats is one of the most popular AP exams taken by students every year. This is because Stats is one of the most versatile AP courses that can earn you Advanced Placement and/or course credit as you enter college, even if you have not finalized your college major. There are numerous other benefits of taking your AP exam for Statistics. Check out our AP Statistics Exam Guide to discover why taking the Stats exam is beneficial for your career.
The AP Statistics score distribution gives insights into exam performance trends. In 2025, a total of 266,791 students took the AP Statistics exam, and 60.3% of test-takers scored a 3 or higher on the exam.
Here’s the AP Stats score distribution for 2025:
| AP Score | % of Students 2025 |
|---|---|
| 5 | 17.0% |
| 4 | 21.4% |
| 3 | 21.9% |
| 2 | 15.9% |
| 1 | 23.7% |
Contrary to popular myth, the AP Stats exam is a challenging subject, but you can be a 5 pointer with the right study tools, course instruction, and dedication.
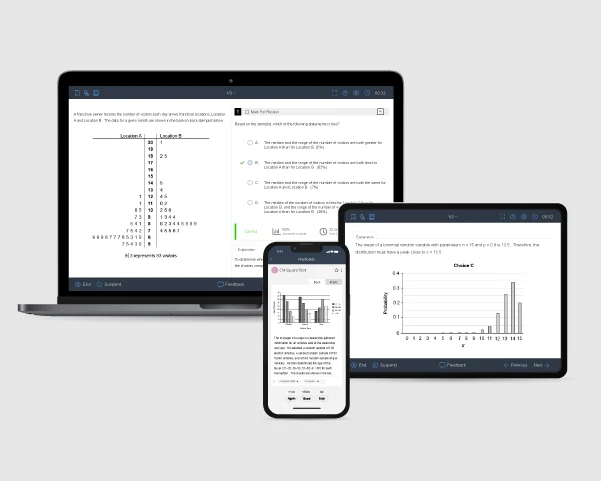
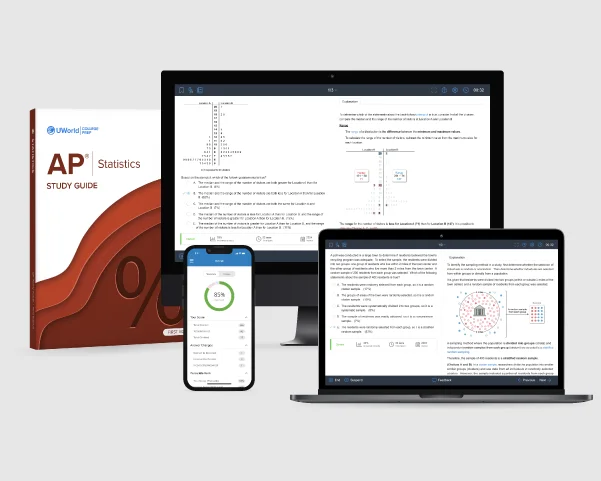
UWorld’s online AP Statistics practice questions will help you get there. Taking practice tests will help you track your progress and clear out doubts to help you form a solid foundation of core statistics concepts. You can also make quick notes and use our flashcards to revise concepts and theorems in a jiffy when reviewing for the exam.

Scoring Pattern for the 2025, 2024, and 2023 AP Statistics Exams
Understanding scoring patterns from the 2023, 2024, and 2025 exam cycles reveals consistent trends. While the College Board has not released a granular unit-by-unit breakdown for the 2025 cycle, historical data highlights where students consistently gain and lose points.
| High-Scoring Areas | Challenging Areas |
|---|---|
|
Focus: Units 1-3 (Data & Sampling) Trend: Students consistently perform strongest here across 2023-2025. MCQ: Historically, the most reliable section for gathering points. FRQ: Questions on
Probability Distributions yield high marks when work is clear and
organized. Key Data: In 2023, tens of thousands of students earned perfect scores on Unit 3 questions. |
Focus: Skill Category 3 (Probability) Trend: This remains the primary "difficulty spike" across all recent exams. MCQ: Performance here consistently lags behind data analysis questions. FRQ:
Students struggle with Simulation & Multi-step Reasoning, often failing to
connect concepts. Key Data: Probability topics have shown slight improvement, but remain the lowest-scoring category. |
|
Strategic Action Goal: Secure your baseline score (1-3 range). Tactic: Master these units early in the year. Do not lose "easy" points here due to careless errors. Note: This is your safety net. If you know Units 1-3, you have a floor for your score. |
Strategic Action Goal: Push your score to the top tier (4-5 range) Tactic: Dedicate 60% of your review time here. Focus on why a simulation works, not just how to calculate. Note: This is the differentiator. This section separates the average scores from the high scorers. |
Upcoming Changes to the AP Statistics Exam
The College Board has announced revisions to the AP Statistics course and exam, but it is important to note that these changes will not affect the May 2026 AP Statistics exam. Students taking the AP Stats exam in May 2026 will follow the current exam format, content framework, scoring structure, and question types described in this guide.
What will change starting with the May 2027 AP Statistics exam?
Beginning with the May 2027 exam, the AP Statistics course will be updated to better align with introductory college statistics courses and emphasize deeper conceptual understanding. The most notable changes include a refined course framework, clearer alignment between skills and content, and an increased focus on statistical reasoning, interpretation, and real-world data analysis. While the exam will continue to assess both multiple-choice and free-response questions, the revisions aim to streamline topics, reduce redundancy, and strengthen emphasis on data-driven decision-making rather than procedural memorization.
The College Board has confirmed that these updates are designed to improve clarity and coherence, not to increase exam difficulty. Additional details, including revised learning objectives and sample questions, will be released closer to the first administration of the updated exam.
If you are planning to take the AP Statistics exam in May 2026, you can prepare confidently using the current exam format and scoring model, as no changes will apply. Students taking the exam in May 2027 or later should expect a revised course framework, though the overall structure of the exam will remain familiar.
AP Statistics Minimum Score Requirement for College Credits
As we mentioned earlier, most colleges across the US recognize AP exam scores to grant credit or advanced placement to their students. Having an AP statistics score of 3 or higher can earn you college credits, which will help you graduate from college early because of the credits you have already earned in high school through AP. While in other colleges, a score of 3 or higher can give you a chance to skip the core statistics course in the first semester and still get a grade for it, which gets labeled as ‘advanced placement’. Some colleges offer both advanced placement and credit, which means you will earn the credits and also be able to skip the course.
Each institution has its own criteria for acknowledging AP Statistics scores. Some colleges accept an AP score of 3, while some demand a 5. Some colleges do not offer you any credit but grant you a placement for your AP score. So, while you are preparing for your AP Statistics exam, it is essential to know your college entrance requirements for this course.
We have compiled a list of colleges around the country and the AP scores they accept for admission to help you narrow your search. Let us have a look:
| Institution | AP Score |
AP Recognition |
Credit/Placement type | Notes |
|---|---|---|---|---|
| Grinnell College | 4 | Credit + Placement |
4 as SST-115 | For major credit for departments that require SST-115 except for Political Science. |
| Harvard University | 5 | - | 4 | Applicable upon activation of “Advanced standing” |
| Louisiana State University at Alexandria | 3 | Credit + Placement |
MATH 2011/STAT/PSYC 2011 | 3 credit hrs |
| Massachusetts Institute of Technology | N/A | Not Awarded | N/A | N/A |
| Mississippi State University | 3 | Credit + Placement |
ST 2113 | 3 credit hrs |
| University of Notre Dame | 5 | Credit+Placement | ACMS 10091 | 3 credit hrs |
| Reed College | N/A | Not Awarded | N/A | N/A |
| Stanford University | N/A | Not Awarded | N/A | N/A |
| Truman State University | 3 | Credit + Placement |
STAT 190 | 3 |
| University of California at Los Angeles | 3/4/5 | Credit | Unassigned | 4 |
| Yale University | N/A | Not Awarded | N/A | N/A |

Frequently Asked Questions
When do AP Statistics scores come out?
What is a good AP Statistics score?
What are some ways to increase my AP Statistics score?
References
- College Board. (2020). AP® Statistics course and exam description.
https://apcentral.collegeboard.org/media/pdf/ap-statistics-course-and-exam-description.pdf?course=ap-statistics - College Board. (2025). Past AP Statistics score distributions. AP Students.
https://apstudents.collegeboard.org/about-ap-scores/score-distributions/ap-statistics - Packer, T. [@AP_Trevor]. (2023, June 28). The 2023 AP Statistics scores [Tweet]. X (formerly
Twitter).
https://twitter.com/AP_Trevor/status/1673775612987691010
Read More About the AP Statistics Exam
Confused about the AP Statistics Exam format? Discover its exam structure and question types that you need to know to boost confidence and kickstart preparation!
How to Study for AP Statistics
Don't waste time looking for the perfect guide! Check out our guide on AP Statistics study plan for the essential review tips on the most commonly tested topics.
AP Statistics Course and Exam Description
A simple course and exam description will save a lot of time. Here's our easy-to-understand AP Statistics CED that clearly explains units, topics, and concepts.
Best AP Statistics Study Guide Comparison
Explore top AP Statistics study guides to find the best resources for the exam. Compare features, pros, cons and reviews to select the perfect guide for success.
Best AP Statistics Prep Course Review
Discover the best AP Statistics prep courses available. Compare key features, pricings, reviews, and benefits to select the course that best fits your learning.
How to Self-Study for AP Statistics
Learn effective tips and strategies to self-study for the AP Statistics exam. Build confidence, master core concepts, and achieve a high score independently too.


