


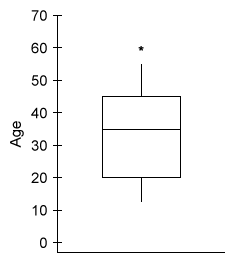
A random sample of 200 video game players was selected, and the age of each player was determined. According to the boxplot below, what is the approximate interquartile range (IQR) of the ages?
- 20
- 25
- 35
- 55
- 60
Explanation:
This is an “interpret graphs” question from Unit 1. There are a couple of things to note:
- AP Statistics questions almost always include a context, so you’ll need to carefully read the question and pick out key information. Some information is important, but other data can be irrelevant or misleading.
- Interpretation of graphs is very important for statistics and is one of the key skills you will need to master to do well on the exam. You will definitely see a graph on the exam, so make sure you are familiar with each type mentioned in the course.
- A box plot is a graph of a distribution of data based on a 5-number summary: minimum, first quartile (Q1), median (2nd quartile), third quartile (Q3), and maximum.
- Quartiles divide a distribution into 4 quarters, each holding about 25% of the data. Consider that quartiles may include outliers (data values outside the whiskers of a boxplot) as part of the distribution.
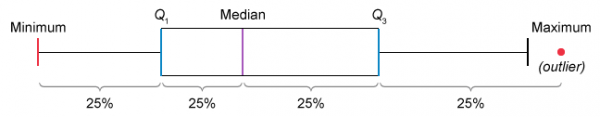
The interquartile range (IQR) measures the range of the middle 50% of the data in a distribution and is equal to the difference between the 3rd quartile (Q3) and the 1st quartile (Q1).
IQR = Q3 - Q1
On a boxplot, these 2 values form the outside edges of the "box." The edges of the given boxplot are approximately 45 (Q3) and 20 (Q1), so the IQR is 45 − 20 = 25.
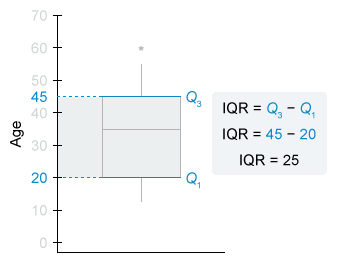
The approximate IQR of the ages is 25. Therefore, the correct answer is (b) 25.
A state is interested in knowing its citizens' opinions on a proposed tax increase on tobacco-based products. The Department of Health Services surveyed a random sample of citizens whose highest level of education is a high school diploma, a bachelor's degree, or a graduate degree. A total of 400 citizens responded with their highest level of education and whether they favor or oppose the tax increase. The results are shown in the table below.
| High level of education | |||||
| High school diploma | Bachelor's degree | Graduate degree | Total | ||
| Opinion on tax increase | Favor | 30 | 42 | 49 | 121 |
| Oppose | 160 | 108 | 11 | 279 | |
| Total | 190 | 150 | 60 | 400 | |
Which of the following statements about a randomly chosen person from these 400 citizens is true?
- If a person favors the tax increase, he or she is more likely to have a bachelor's degree as the highest level of education than to have only a high school diploma.
- If a person opposes the tax increase, he or she is more likely to have a postsecondary (bachelor's or graduate) degree as the highest educational level than to have only a high school diploma.
- The person is more likely to favor the tax increase if he or she has only a high school diploma as the highest educational level than if he or she has a postsecondary degree (bachelor's or graduate).
- The person is more likely to have only a high school diploma as the highest educational level than to have a postsecondary degree (bachelor's or graduate).
- The person is more likely to favor the tax increase than to oppose the tax increase.
Explanation:
This is a “contingency table" question from Unit 2. Contingency table questions involve simple calculations and are more focused on concepts. Typically, they involve navigating the difference between joint relative frequencies (values in individual cells divided by the table total) and conditional relative frequencies (values in individual cells divided by row/column totals). You'll need to carefully read the question and pick out key terms (“If, then”) that indicate particular types of relative frequencies or probabilities.
The answer choices all require a comparison of the likelihood (probability) of 2 events from the given table. To find the probability P of an event, use the following formula:

- Analyze the probabilities of each choice to determine which statement is true. If 2 probabilities have the same number of possible outcomes, it is necessary to compare only the desired outcomes.
- Notice in the "favor" row that there are more people with bachelor's degrees than with high school diplomas as their highest level of education.
- The number of people with a bachelor's degree (42) represents a greater proportion of those who favor the tax increase (121) than does the number of people with only a high school diploma (30).
Therefore, the correct answer is (a).
An insurance company surveyed each of its 130 employees to determine the proportion who donate to charitable organizations. Which of the following statements is true?
- The data from this survey should not be used because it is an observational study.
- It is necessary to use a confidence interval in order to estimate the proportion of employees who donate to charity.
- It is not necessary to use an inference procedure to determine the proportion of employees who donate to charity because the survey was a census of all employees.
- The result of this survey can be used to prove that working for the company causes employees to donate to charity.
- The sample of employees was not selected randomly, so the survey will not provide useful information.
Explanation:
This is a question from Unit 3, where questions do not involve calculations. Instead, interpret the way data collection influences what can and cannot be said about a population. It is critical to know the vocabulary terms for concepts such as sampling methods and experimental designs. Here are a few steps to follow if you face questions like this on the exam:
- A population is all the individuals of a specific group (ex. U.S. citizens, customers of an ice cream shop).
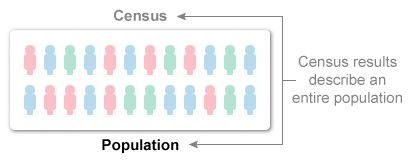
A census collects data from an entire population to draw conclusions about the population. Any result from a census also describes the population. There is no need to make inferences about the population.

- It is known that the insurance company surveyed each of its 130 employees, so they conducted a census of all employees.
Therefore, the statement that is true is (c): It is not necessary to use an inference procedure to determine the proportion of employees who donate to charity because the survey was a census of all employees.
A tutoring company prices lessons in groups of 10 lessons. The probability distribution of X, the number of lessons sold to a single customer, is summarized in the table below.
| X = the number of lessons | 10 | 20 | 30 | 40 | 50 |
|---|---|---|---|---|---|
| Probability | 0.15 | 0.25 | 0.30 | 0.20 | 0.10 |
The expected value of the probability distribution of X is 28.5 and the standard deviation is 11.95. There is a fixed cost of materials and advertising for the lessons. The profit Y, in dollars, for a single customer can be predicted by Y = 25X − 50. What is the standard deviation of Y ?
- $248.75
- $298.75
- $348.75
- $662.50
- $700.00
Explanation:
Unit 4 questions are mostly pure mathematics. All of the formulas from Unit 4 can show up on the exam, and there are several things to keep in mind for these questions:
- They allow the most creativity. Typically, they can be solved in many ways. If you find 1 method that you know doesn't work, try thinking about the question in another way.
- They are the most mathematical and require the most practice.
- They receive the lowest scores but represent a large portion of the test. Try doing as many practice questions as you can to be prepared.
Now, let's solve this problem with these pointers:
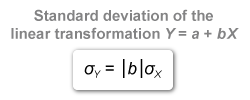
- A linear transformation of a random variable X is a transformed random variable Y formed by multiplying every value of X by a constant b and then adding another constant a (Y = a +bX)
The standard deviation (SD) of a linearly transformed random variable Y is equal to the SD of the original variable X multiplied by the absolute value of the constant b.

- It is given that the profit Y, in dollars, for a single customer can be predicted by the equation Y = 25X − 50, so Y is a linear transformation of X with a multiplicative constant of 25.
Plug the value of b (25) and the standard deviation of X (σX = 11.95) into the formula for the SD of a linear combination and solve for the standard deviation of Y (σY).

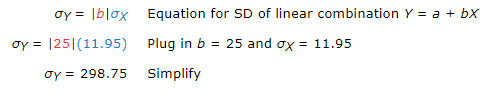
Therefore, the standard deviation of Y is $298.75. The correct answer is (b).