


General Addition Rule
In Words: The left side of the equation represents the probability of the “union” of two events A and B. The right side is the addition then subtraction of three separate probabilities: the probability of event A, and the probability of event B, and the “joint probability” of the events A and B. The joint probability of the events A and B is the probability that they both occur.
Description: The “union” of two events A and B is the probability that event A or event B (or both) will occur. One way to understand the union of events is as a Venn diagram.
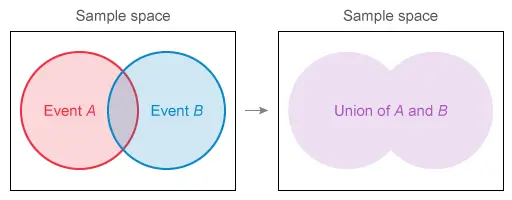
The general addition rule states that the purple area in the above diagram is equal to the red area plus the blue area, minus the section they overlap. This is because if the red and blue areas are added together, the central area is counted twice.
Application on AP Exam: The general addition rule (and a special case of the general addition rule - the addition rule for mutually exclusive events) is the main rule used to calculate the probability of the union of two events. It is also the only rule on the exam that explicitly relates the probability of a union to the joint probability, so any question that involves these quantities will likely use this formula.
Conditional Probability
In Words: The left side gives the conditional probability of A given B because the “|” symbol represents “given”. The right side includes the ratio of two probabilities: the joint probability of events A and B and the probability of event B.
Description: This is a definitional formula for the “conditional probability” that an event A occurs given that another event B has occurred.
Application on AP Exam: This formula is the main way to calculate conditional probabilities for the AP exam. If any question asks for the probability of an event that is “given” or similar language, then you will likely be able to use this formula to solve that question. Another application is that by rearranging this formula (multiplying both sides by P(B )), you will get another important formula for the test - the multiplication rule.
Mean of Discrete Random Variables
In Words: This formula gives the mean of a discrete random variable X. Consider that in order to use this formula, you have to know every possible value of X as well as their probabilities. The left two expressions are actually equivalent notation to represent the mean of a discrete random variable. The right side in steps says (1) Multiply each possible value of X by its probability,, and then (2) Add up the resulting values.
Description: The mean of a discrete random variable X describes the long-run average if the chance process resulting in X is repeated many times. It is also a measure of the center of the probability distribution of X.
Application on AP Exam: You should be able to calculate the mean of a discrete random variable X if the values of X as well as the probabilities are given in a table.
Standard Deviation of Discrete Random Variables
In Words: This formula gives the standard deviation of a discrete random variable X. Consider that in order to use this formula, you have to know every possible value of X, their probabilities, and the .The left side gives the notation for the standard deviation of a discrete random variable X (the subscript). The right side in steps says (1) Subtract the mean from each possible value of X, then square the resulting values, (2) Multiply these values by the corresponding probabilities, (3) Add everything up, and then (4) Take the square root of the result.
Description: Similarly to the standard deviation for a dataset, the standard deviation of a discrete random variable describes the “spread” or “variability” of that random variable.
Application on AP Exam: It is unlikely that you will need this formula purely for calculation. However, it may be possible for free response questions.
Probability Distribution of Binomial Random Variables
P (X = x ) = (
where x = 0, 1, 2, 3, ..., n
In Words: The left side of the equation is notation for the probability that the binomial random variable X is equal to a specific value x. The right side of the equation has several parts. The large parentheses around n and x is referred to as the binomial coefficient and is called “n choose x”. The other parts involve multiplying the binomial coefficient by the probability of success (p) to the number of successes (x), then multiplying by the probability of failure (1 - p) to the number of failures (n - x).
Description: A binomial random variable counts the number of successes in n independent trials, in which each trial has a fixed probability p of a “success”. For a binomial distribution parameters n and p, the probability distribution gives the probability of any given possible number of successes x.
Application on AP Exam: You should be able to recognize a variable as binomial, and using given information, determine the n and p. It is possible you will need to plug those values into this formula to identify the probability.that the variable equals a given value x. It is unlikely you will need to then calculate the exact value, but if you do need to, it is easier to use a calculator.
Mean of Binomial Random Variables
In Words: It is possible to use the formula for the mean of a discrete random variable to calculate the mean of a binomial random variable. However, this formula specific to binomially distributed random variables is much easier to navigate. The left side is notation for the mean of a binomial random variable X. The right side is straightforward - multiply the number of trials n by the probability of success for each trial p.
Description: The mean of a binomial random variable X has the sample interpretation as the mean of any discrete random variable - it is the long-run average if the chance process resulting in X is repeated many times. It is also a measure of the center of the probability distribution of X.
Application on AP Exam: You should be able to recognize a variable as binomial, and using given information, determine the n and p. Given values of n and p, you should then be able to calculate the mean of a binomial random variable. Also, this formula can tell you about the relationship between the parameters and the value of the mean of a binomial random variable (e.g. increasing n increases the mean).
Standard Deviation of Binomial Random Variables
In Words: It is possible to use the formula for the standard deviation of a discrete random variable to calculate the standard deviation of a binomial random variable. However, the formula for the standard deviation of a binomial random is much simpler. The left side of the formula is notation for the standard deviation of a binomial random variable X. The right side in steps is (1) Multiply the sample n, the probability of success p, and the probability of “failure” (1 - p), then (2) Take the square root of the result.
Description: The standard deviation of a binomial random variable X has the sample interpretation as the standard deviation of any discrete random variable - it describes the “spread” or “variability” of that random variable.
Application on AP Exam: You should be able to recognize a variable as binomial, and using given information, determine the n and p. Given values of n and p, you should then be able to calculate the standard deviation of a binomial random variable. Also, this formula can tell you about the relationship between the parameters and the value of the standard deviation of a binomial random variable.
Probability Distribution of Geometric Random Variables
P (X = x ) = (1 - p )x - 1 p
where x = 1, 2, 3, ...
In Words: The left side of the equation is notation for the probability that the geometric random variable X is equal to a specific value x. The right side of the equation states that for a given value of x, raise the probability of a failure (1 - p) to the x - 1 power, and then multiply by the probability of success p.
Description: A geometric random variable gives the number of the trial on which the first success in a sequence of independent trials occurs, where each trial has probability p of success. For a geometric variable with parameter p, the probability distribution gives the probability that the first success occurs on trial number x.
Application on AP Exam: You should be able to recognize a variable as geometric, and using given information, determine the value of p. It is possible you will need to plug those values into this formula to identify the probability.that the variable equals a given value x. You are more likely to need to calculate the exact value of the probability distribution of a geometric random variable than a binomial random variable.
Mean of Geometric Random Variables
In Words: It is possible to use the formula for the mean of a discrete random variable to calculate the mean of a geometric random variable. However, this formula is much easier to navigate. The left side is notation for the mean of a geometric random variable X. The right side is straightforward - calculate the inverse of p (that is, divide 1 by p).
Description: The mean of a binomial random variable X has the sample interpretation as the mean of any discrete random variable - it is the long-run average if the chance process resulting in X is repeated many times. It is also a measure of the center of the probability distribution of X.
Application on AP Exam: You should be able to recognize a variable as geometric, and using given information, determine p. Given the value of p, you should then be able to calculate the mean of a geometric random variable. Also, this formula can tell you about the relationship between the parameters and the value of the mean of a geometric random variable (e.g. increasing p decreases the mean).
Standard Deviation of Geometric Random Variables
In Words: It is similarly possible to use the formula for the standard deviation of a discrete random variable to calculate the standard deviation of a geometric random variable. However, this formula is much simpler. The left side of the formula is notation for the standard deviation of a geometric random variable X. The right side in steps is (1) Take the square root of 1 - p (the probability of failure on any trial), then (2) Divide the result by p.
Description: The standard deviation of a geometric random variable X has the sample interpretation as the standard deviation of any discrete random variable - it describes the “spread” or “variability” of that random variable.
Application on AP Exam: You should be able to recognize a variable as geometric, and using given information, determine p. Given the value of p, you should then be able to calculate the standard deviation of a geometric random variable. Also, this formula can tell you about the relationship between the parameter and the value of the standard deviation of a binomial random variable.
Table A: Standard Normal Probability Table
Description: Table A gives the left-sided area (area from a value z to negative infinity) under the standard normal distribution curve. The standard normal distribution is a normal distribution with mean equal to 0 and standard deviation equal to 1. It can be used to describe probabilities for any normal distribution (not just the standard normal distribution) through the use of z-scores. It is also useful for finding the p-values for z-tests and the critical values for z-intervals.
Using Table A: To determine the area under the standard normal curve to the left of a value of z, consider that the rows of the table correspond to the “ones” and “tenths” place of the value of z, and that the columns correspond to the “hundredths” place of the value of z.
For example, suppose that you wish to determine the area to the left of z = 1.10. First, you should find the row that corresponds to a ones/tenths value of “1.1”. Second, find the column that corresponds to the value “x.x0”. The intersection of this row and column is the left-tailed area (probability).

Note: It is also possible to use this table to determine the area (probability) to the right of a value of z. First find the left-tailed area, then subtract that area from 1. This is because the total area under the curve must be equal to 1.
Table B: t-Distribution Critical Values Table
Description: Table B gives the values (t-values) of the t-distribution that yield a right-tailed probability of a given value. There are actually many different t-distributions, depending on the value of the degrees of freedom df, so the table also includes the possible values of the degrees of freedom. Consider that the values given in this table are different from Table A. Table A is made up of probabilities, while Table B is made up of values of a t-distributed random variable.
Using Table B: To find a t-score with a certain probability lying above it (to the right of it), first identify the df of the t-distribution. The df is generally specific to the t-test or t-interval being performed, but is based on the sample size (e.g. n − 1). Second, identify the appropriate row for the df. Then, you can find the appropriate “Tail probability” by looking at the top of the table.
For example, suppose that you wish to determine the t-score from a t-distribution with a probability of .025 lying above it, for df = 11. First, you should find the row that corresponds to df = 11. Second, find the column that corresponds to the tail probability .025. The intersection of this row and column is the t-score.
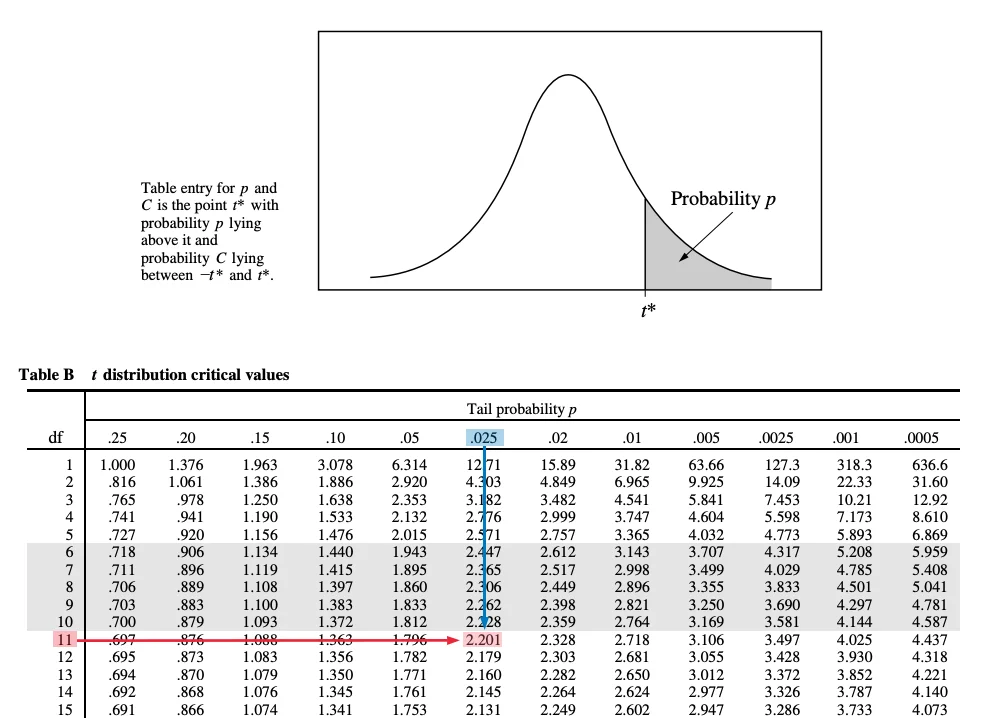
There is another use for Table B. At the bottom of the table, notice that each column is labeled with “Confidence level” percentages. This shows that Table B can also be used to find the critical values necessary to achieve given confidence levels. Critical values can be found for t-distributions of a given df value, or for the normal distribution (df = ∞). For example, a z-interval for a proportion is based on the normal distribution. The critical value for a 95% z-interval for a proportion can be found by identifying the ∞ row and the “95%” column at the bottom of the table.
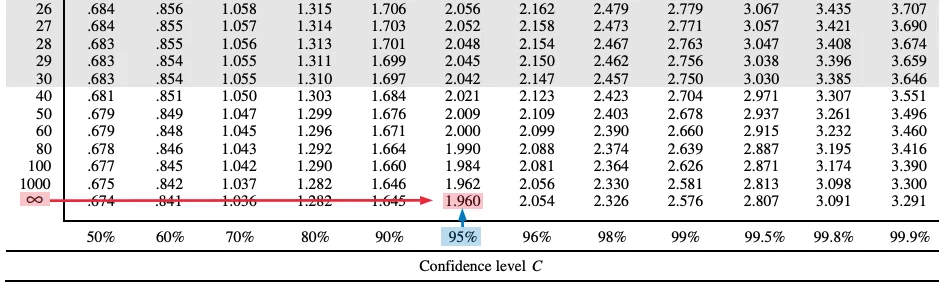
Table C: Chi-square Table
Description: Table C gives the values of the chi-square distribution that yield a right-tailed probability of a given value. Similarly to the t-distribution, there are many different chi-square distributions, depending on the value of the degrees of freedom df. Similarly to Table B, this table also includes the possible values of the degrees of freedom.
Using Table C: The procedure to find a chi-square value with a certain probability lying above it (to the right of it) is the same as the procedure for Table B. Note, however, that there is NOT a confidence level portion of the table for the chi-square distribution.