How to Solve Digital SAT® Math Problems
Tricks and Strategies
The Digital SAT® Math Section tests a wide range of topics, spanning multiple years of math education. The breadth of the exam can make studying for it seem daunting. Thankfully, you can simplify this task by familiarizing yourself with the categorizations that the College Board® uses to group Digital SAT math question types. This grouping method is especially helpful for advanced math students, allowing them to focus their studies on unfamiliar domains. By tackling one subject at a time, they can learn Math Section strategies more effectively, rather than trying to tackle everything all at once.
Below, we've broken down the Digital SAT Math Section into its four official domains: Algebra, Problem Solving and Data Analysis, Advanced Math, and Geometry and Trigonometry. Read on for examples, questions, strategies, and tricks for each domain.
Algebra
Digital SAT's "Algebra" domain, formerly known as "Heart of Algebra," emphasizes linear functions, equations, and inequalities. Questions within this domain also involve systems of equations without any exponents or word problems related to rates (growth in size, price per unit, or speed).
Approximately 13-15 questions (35%) of all math questions on the Digital SAT are derived from this domain.
Tricks and strategies to ace Algebra questions
The key to approaching linear functions correctly is understanding what they represent. Begin by drawing a graph or annotating an existing one. Graphs of linear equations help visualize slopes and intercepts, and the intersection of two such graphs provides the solution to a system of linear equations. If you’re unsure how to plot a graph for a given Algebra question, rewrite the equation in slope-intercept form.
-
Slow Down for Complicated or Multi-Step Problems:
If you encounter an algebra question with many steps, it is vital to slow down. Take your time. Spend extra effort on complex problems to avoid making silly mistakes or missing a step.
-
Practice Complicated Problems:
If you encounter a problem on test day that requires more steps than you expect or are accustomed to, it is easy to become overwhelmed. In your practice work, build up your confidence with these questions. Show your work and proceed slowly to avoid silly mistakes.
-
Build up Your Toolbox:
Specifically, learn your formulas! This is crucial. Memorizing the formulas is necessary for questions focusing on linear equations, absolute values, and graphs.
-
Check Your Work:
You can check your work on multiple-choice questions by testing your answer choices using the relevant formula. Testing the options in the answer choices is an excellent strategy for solving tricky equations and inequalities.
Algebra examples
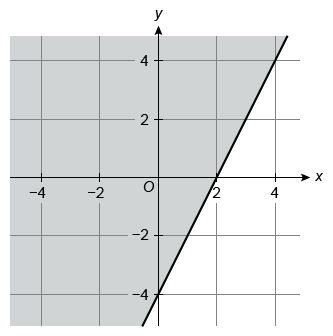
The solutions to which inequality are represented by the shaded region of the graph?
| A. y ≤ −2x − 4 | |
| B. y ≤ −4x − 2 | |
| C. y ≥ 2x − 4 | |
| D. y ≥ 4x − 2 |
Hint:
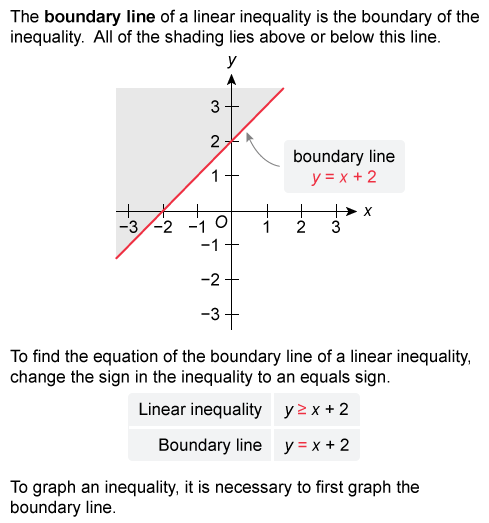
The graph of a linear inequality of the form y ≥ mx + b has shading above a boundary line.
The graph of a linear inequality of the form y ≤ mx + b has shading below a boundary line.
The solutions represented by the given graph consist of all points in the shaded area and on the boundary line. Analyze the shading and the boundary line of the given graph and use a process of elimination.
The given graph is shaded above the line, so the inequality must be in the form y ≥ mx + b. Eliminate Choices A and B because they represent graphs with shading below the boundary line.

The boundary line of the given graph has a y-intercept of −4, so the boundary line equation in slope-intercept form must be y = mx − 4. Therefore, the inequality must be in the form y ≥ mx − 4.
Eliminate Choice D because it does not match this form.
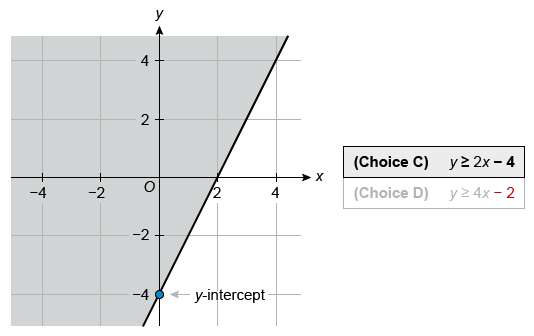
Of the choices, only the inequality in Choice C has a graph with shading above the boundary line and a y-intercept of −4. By process of elimination, Choice C has the solutions represented by the shaded region.
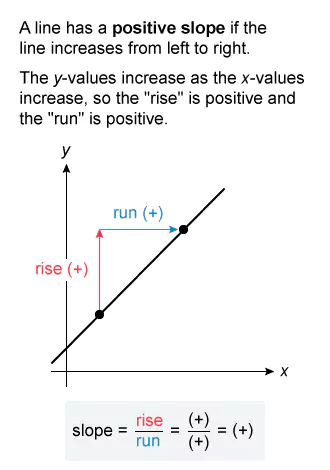
Elimination strategy: The boundary line of the given graph has a positive slope. Therefore, it is possible to eliminate Choices A and B because each has a boundary line equation with a negative slope.
Things to remember:
- The graph of a linear inequality of the form y > mx + b or y ≥ mx + b has shading above a boundary line.
- The graph of a linear inequality of the form y < mx + b or y ≤ mx + b has shading below a boundary line.
- The equation of the boundary line in slope intercept form is y = mx + b, where m is the slope and b is the y-intercept.
Ryan used yarn to knit rows of a scarf. The function w(r) = −4r + 840 approximates the length, in feet, of yarn Ryan had remaining after knitting r rows. Which statement is the best interpretation of the y-intercept of the graph of y = w(r) in the xy-plane in this context?
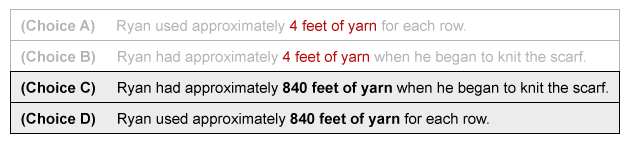
| A. Ryan used approximately 4 feet of yarn for each row. | |
| B. Ryan had approximately 4 feet of yarn when he began to knit the scarf. | |
| C. Ryan had approximately 840 feet of yarn when he began to knit the scarf. | |
| D. Ryan used approximately 840 feet of yarn for each row. |
Hint:
The linear function is in slope-intercept form y = mx + b, where m is the rate of change in quantity y per quantity x and b is the initial value.
The given linear function w(r) = −4r + 840 is in slope-intercept form y = mx + b, where m is the rate of change (slope) and b is the y-intercept.

Compare the given equation w(r) = −4r + 840 to y = mx + b to see that w(r) corresponds to y and that r corresponds to x. Identify the y-intercept b.

The y-intercept b is 840. Eliminate Choices A and B because they do not describe the number 840.
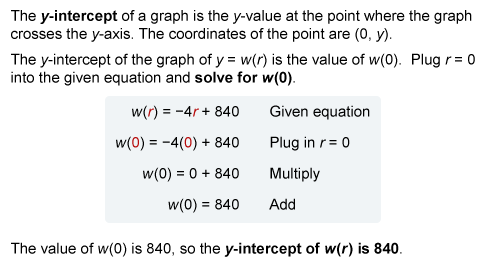
The y-intercept is the value of y when x = 0, so it represents an initial amount of quantity y.
It is given that w(r) represents the amount of yarn, so the y-intercept represents the initial amount of yarn. Eliminate Choice D because it does not describe the initial amount of yarn.
Therefore, the best interpretation of the y-intercept is Ryan had approximately 840 feet of yarn when he began to knit the scarf.
Note: It is also possible to plug r = 0 into the given equation to determine that the y-intercept of w(r) is 840.
(Choice A) "Ryan used approximately 4 feet of yarn for each row" is the best interpretation of the slope m (instead of the y-intercept b).
(Choice B) "Ryan had approximately 4 feet of yarn when he began to knit the scarf" may result from mistaking the value of m (instead of b) to be the y-intercept for an equation in slope-intercept form y = mx + b.
(Choice D) "Ryan used approximately 840 feet of yarn for each row" may result from mistaking the y-intercept to represent the slope (instead of the initial value).
Things to remember:
The slope-intercept form of a linear equation is y = mx + b, where m is the rate of change (slope) and b is the initial value (y-intercept).
p(−2x − 1) + x = 9x − 4
The equation above has no solutions. If p is a constant, then what is the value of p ?
| A. − 9 / 2 | |
| B. −4 | |
| C. 0 | |
| D. 4 |
Hint:
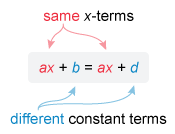
To find the value of p for which the given equation p(−2x − 1) + x = 9x − 4 has no solution, first rewrite the left side so that the equation is in the form ax + b = cx + d.
A linear equation in the form ax + b = cx + d has no solution when the x-terms are the same and the constant terms are different.
To find the value of p for which the given equation p(−2x − 1) + x = 9x − 4 has no solution, first rewrite the left side so that the equation is in the form ax + b = cx + d.
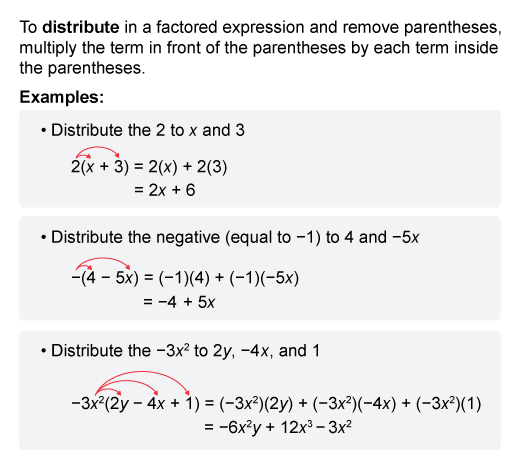
Distribute p to each term in (−2x − 1). Then group the x-terms and factor out x.
| p(−2x − 1) + x = 9x − 4 | Given equation |
| −2px − p + x = 9x − 4 | Distribute p to (−2x − 1) |
| −2px + x − p = 9x − 4 | Rearrange to group x-terms |
| (−2p + 1)x − p = 9x − 4 | Factor out x: x = 1x |
Now compare the x-terms and the constant terms of the equation (−2p + 1)x − p = 9x − 4 to find the value of p.
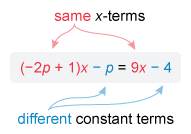
The x-terms (−2p + 1)x and 9x must be the same for the equation to have no solution. The x-terms are the same when their coefficients are equal, so set −2p + 1 equal to 9.
The constant terms −p and −4 must be different for the equation to have no solution, so −p cannot equal −4.
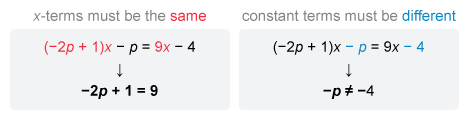
For the constant terms to be different, −p ≠ −4 and therefore p ≠ 4. Eliminate Choice D.
Now solve the equation −2p + 1 = 9 to find the value of p.
| −2p + 1 = 9 | Coefficients of x-terms are equal |
| −2p = 8 | Subtract 1 from both sides |
| p = −4 | Divide both sides by −2 to isolate p |
The given equation has no solutions when p = −4.
(Choice A) − 9 / 2 may result from disregarding the 1x term when rewriting the given equation.
(Choice C) 0 may result from the misconception that a linear equation has no solutions when the x-term or the constant term is equal to 0. A linear equation in the form ax + b = cx + d has no solutions when the x-terms are the same and the constant terms are different.
(Choice D) 4 may result from setting the constant terms equal (instead of the x-terms), but the constant terms must be different for a linear equation to have no solution. This answer may also result from a sign error.
Things to remember:
A linear equation in the form ax + b = cx + d has no solutions when the x-terms are the same and the constant terms are different. For example, the equation 2x + 1 = 2x + 4 has no solution.
Alternate Method :
It is also possible to analyze the given equation at each possible value of p from the answer choices to see which results in an equation with no solution.
An equation of the form ax + b = cx + d has no solution when the x-terms are the same and the constant terms are different.
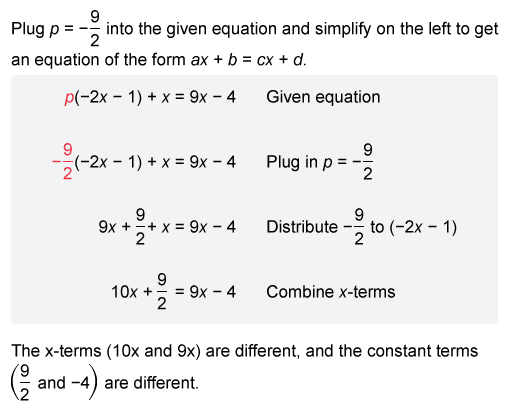
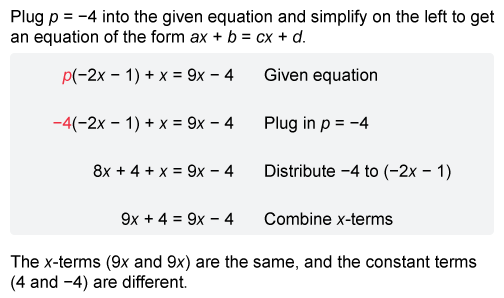
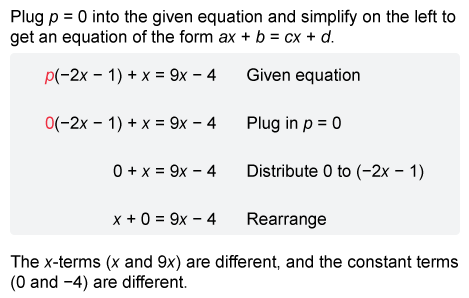
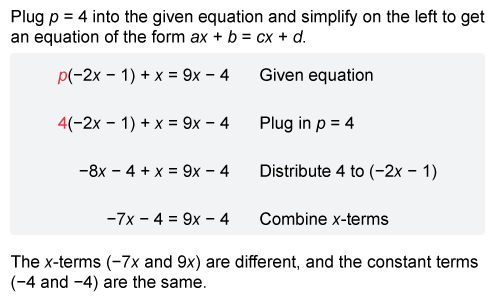
Plug each choice into p(−2x − 1) + x = 9x − 4 for p to see which results in an equation with the same x-terms and different constant terms.
| (Choice A)
p = − 9 / 2 |
different x-terms different constants (see how) |
| (Choice B)
p = −4 |
same x-terms
different constants
(see how) |
| (Choice C)
p = 0 |
different x-terms
different constants
(see how) |
| (Choice D)
p = 4 |
different x-terms
same constants
(see how) |
The given equation p(−2x − 1) + x = 9x − 4 has the same x-terms and different constant terms when p is equal to −4. Therefore, the equation has no solutions when p = −4.
Problem-Solving and Data Analysis
While all Digital SAT Math problems require problem-solving, this category refers to solving problems that rely on ratios, percentages, and the collection and use of one or two variables. You can recognize these questions by their reference to statistical terms like mean, median, and mode; their use of scatter plots and lines of best fit; their description of experiments and data collection or sampling methods; and their inclusion of percent or ratio relationships. Also, although only present on some exams, box-and-whiskers plot questions on the Digital SAT belong to this section.
This domain accounts for only 5-7 questions (15%) of the total Digital SAT math questions.
Tricks and strategies to ace Problem-Solving and Data Analysis questions
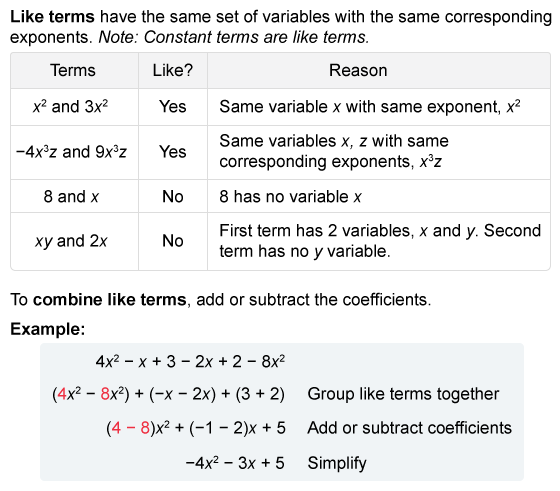
As you prepare for this section, keep track of definitions for technical terms and, when referring to values or sets of values, learn how to calculate them. Digital SAT math questions frequently include wrong answers based on common errors or misconceptions. For example, if a question asks about the mean of a dataset, the answer choices will likely include the median. Once you've mastered the relevant vocabulary, you'll approach this domain more confidently and answer the questions with less distraction.
Another common challenge in this section is that the data points in these questions may appear randomly rather than in numerical order. When calculating statistical values like the median, numerical order is critical. Therefore, reordering any values is always worth taking a few seconds.
Problem-Solving and Data Analysis examples
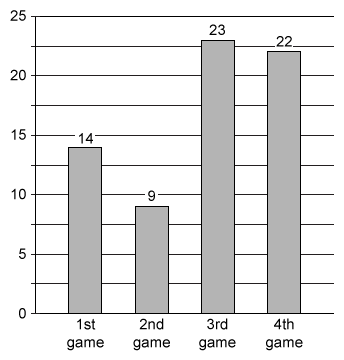
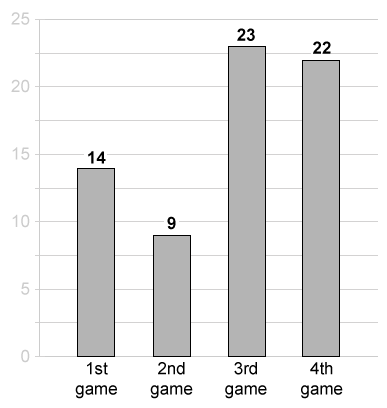
The bar graph shows the number of points scored by a football team in each of four games. For these four games, how much greater is the median number of points scored than the mean number of points scored?
Hint:
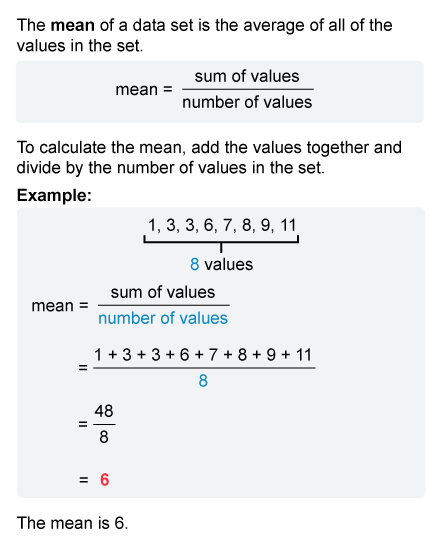
The mean of a data set is the sum of the values divided by the number of values.
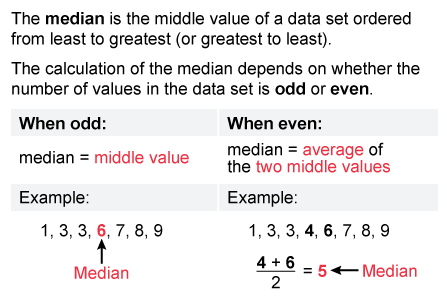
The median is the middle of a data set when all values are ordered numerically.
To find how much greater the median number of points is than the mean number of points, calculate each measure separately and then subtract the mean from the median.
First identify from the given bar graph that the the numbers of points scored in the 4 games were 14, 9, 23, and 22.
Mean score
The mean of a data set is the sum of the values divided by the number of values.
The sum of the values is the sum of the numbers of points scored and the number of values is the number of games.

Plug the numbers of points (14, 9, 23, and 22) and the number of games (4) into the expression for the mean and simplify to calculate the mean score.
| sum of points scored / number of games | Mean number of points |
| 14+9+23+2 / 24 | Plug in values |
| 68 / 17 | Add in numerator |
| 17 | Divide |
The mean number of points is 17.
Median score
The median is the middle of a data set when all values are ordered numerically. For a data set with an even number of values, the median is the average of the middle two.
The numbers of points scored are 14, 9, 23, and 22. Order these values numerically and then calculate the average of the middle two to find the median number of points scored.
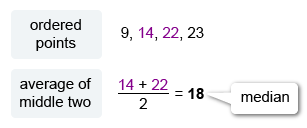
The median number of points is 18.
The mean is 17 points and the median is 18 points. Subtract 18 − 17 = 1 to see that the the median is 1 point greater than the mean.
Things to remember:
- The mean of a data set is the sum of the values divided by the number of values.
- The median is the middle of a data set when all values are ordered numerically. For a data set with an even number of values, the median is the average of the middle two.
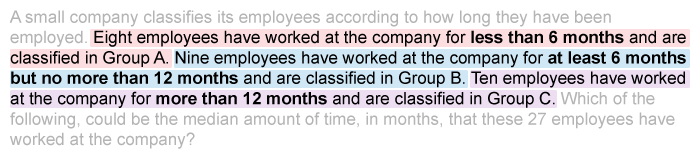
A small company classifies its employees according to how long they have been employed. Eight employees have worked at the company for less than 6 months and are classified in Group A. Nine employees have worked at the company for at least 6 months but no more than 12 months and are classified in Group B. Ten employees have worked at the company for more than 12 months and are classified in Group C. Which of the following could be the median amount of time, in months, that these 27 employees have worked at the company?
| A. 5.5 | |
| B. 7 | |
| C. 12.5 | |
| D. 16 |
Hint:
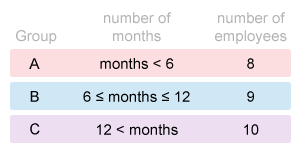
The median of a data set is the middle of the set when all values are ordered numerically.
The median of a data set is the middle of the set when all values are ordered numerically. When the number of values is odd, the median is the middle value.
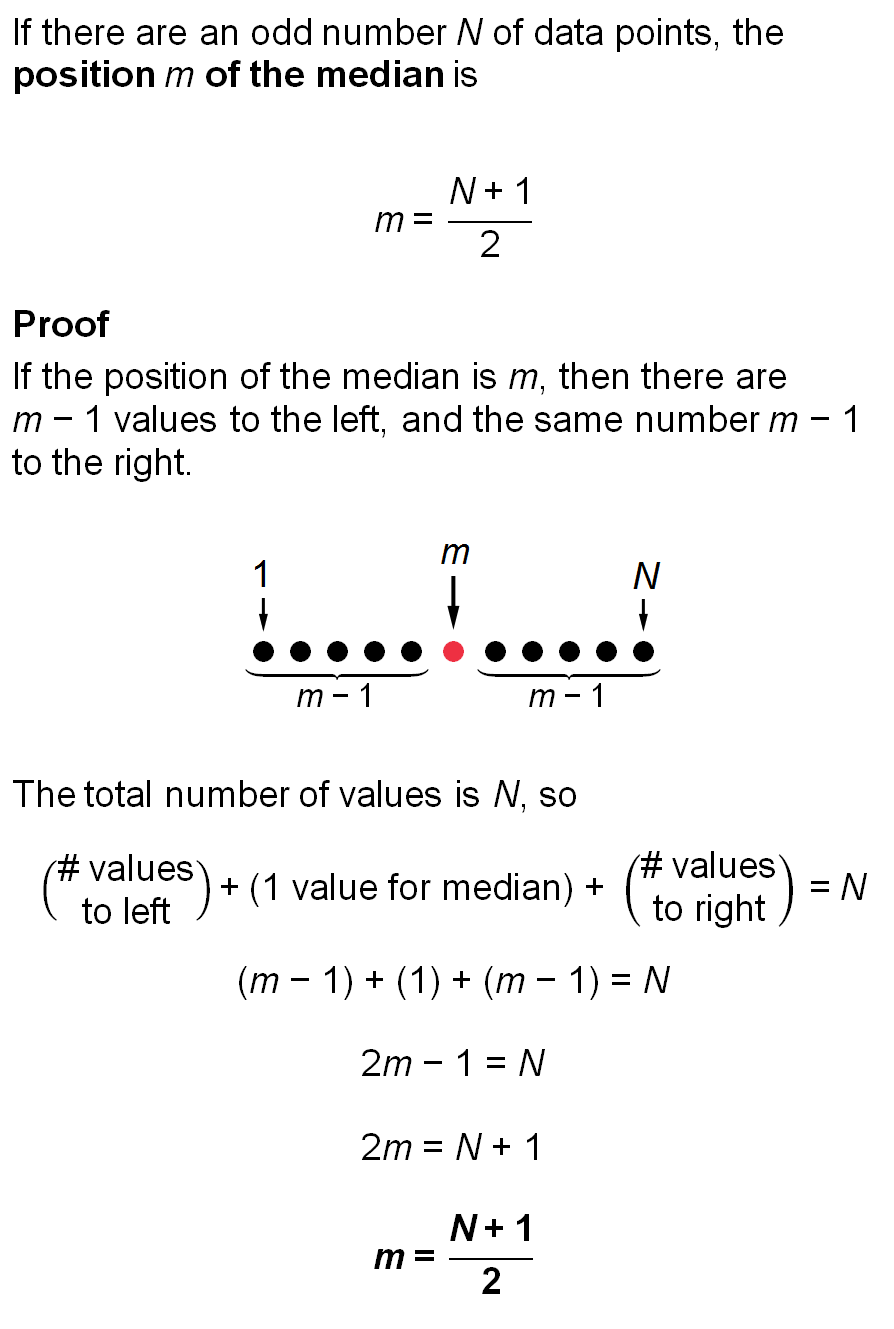
The number of months each employee has worked at the company is unknown, but the range of months for each group is given. First consider the groups from least to greatest according to the ranges of months worked.
It is given that that there are 27 employees, so the median number of months must be the number worked by the 14th employee (proof).
Starting with the first range, add the number of employees in each successive group to find the group that contains the 14th employee and identify the range of months that employee has worked.
The 14th employee was in Group B, so the 14th employee worked at least 6 months and no more than 12 months.
Of the choices, only Choice B falls within this range. Therefore, the median number of months could be 7.
(Choices A, C, and D) These choices are not possible numbers of months because they do not fall within the range worked by the 14th employee (at least 6 months and no more than 12 months).
Things to remember:
The median of a data set is the middle of the set when it is ordered numerically. When the total number of values is odd, the median is the middle value. When it is even, the median is the average of the middle two values.
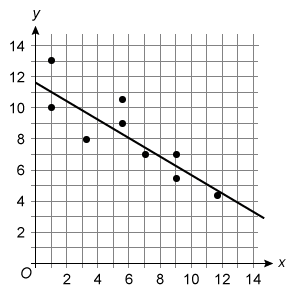
The scatterplot shows the relationship between two variables, x and y. Of the following, which equation best represents the line of best fit shown?
| A. y = −11.7 − 0.6x | |
| B. y = −11.7 + 0.6x | |
| C. y = 11.7 − 0.6x | |
| D. y = 11.7 + 0.6x |
Hint:
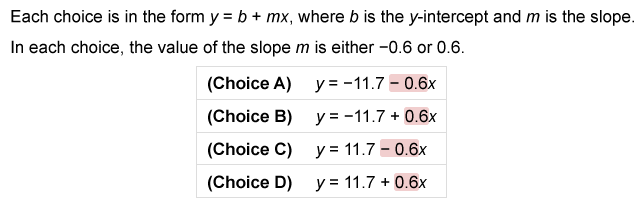
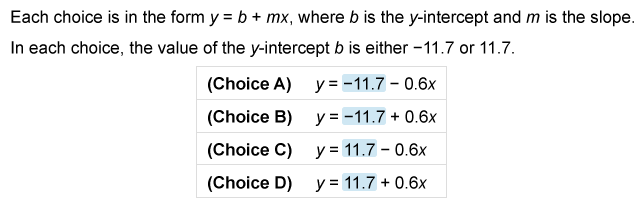
The equation of a line in slope-intercept form is y = mx + b, where m is the slope and b is the y-intercept.
The equation of a line in slope-intercept form is y = mx + b, where m is the slope and b is the y-intercept.

In each choice, the value of m is −0.6 or 0.6 and the value of b is −11.7 or 11.7. Therefore, it is possible to determine which equation best represents the line of best fit based on only the signs of the slope and y-intercept.
slope
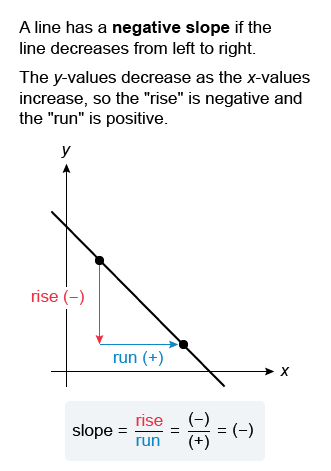
A line with negative slope decreases from left to right.
The given line of best fit decreases from left to right, so its slope is negative.
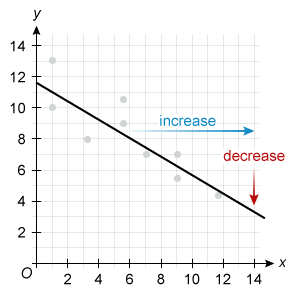
Therefore, the slope must be m = −0.6.
y-intercept
The y-intercept of a line is the y-value of the point where the line crosses the y-axis. The given line crosses the y-axis at a positive y-value, so its y-intercept is positive.
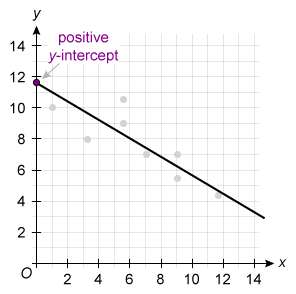
Therefore, the y-intercept must be b = 11.7.
Plug m = −0.6 and b = 11.7 into slope-intercept form to get an equation of the line best fit y = −0.6x + 11.7. To match the form of the answer choices, rearrange the equation to get y = 11.7 − 0.6x.
(Choice A) y = −11.7 − 0.6x is incorrect because its y-intercept is negative (instead of positive).
(Choice B) y = −11.7 + 0.6x is incorrect because its slope is positive (instead of negative), and its y-intercept is negative (instead of positive).
(Choice D) y = 11.7 + 0.6x is incorrect because its slope is positive (instead of negative).
Things to remember:
- A linear equation in slope-intercept form is y = mx + b, where m is the slope and b is the y-intercept.
- A line with a positive slope is increasing, and a line with a negative slope is decreasing.
Advanced Math
This domain covers a wide range of topics that go beyond the “Algebra” section and delve into Algebra II. Depending on the structure of your classes, it may also potentially touch on precalculus. Specifically, this category includes any nonlinear functions, expressions, or equations, such as quadratics, exponential and square root functions, and systems of equations with at least two variables. You can recognize these questions by their references to quadratics in any form, expressions with exponents or roots, and function notation— mainly composite functions (e.g., g(f(x))).
This domain accounts for 13-15 questions (35%) on the Digital SAT math exam.
Tricks and strategies to ace Advanced Math questions
This category primarily focuses on higher-order functions and expressions, so familiarize yourself with the manipulation of different types of expressions you will encounter. For instance, solving or rewriting quadratic functions using techniques such as factoring, completing the square, and the quadratic formula will significantly enhance your comfort and consistency with these types of questions. Similarly, it's beneficial to understand how to rewrite exponents and roots in terms of each other, as this can simplify and make many equivalent expression questions easier.
Advanced Math examples
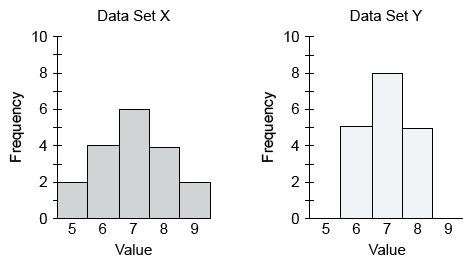
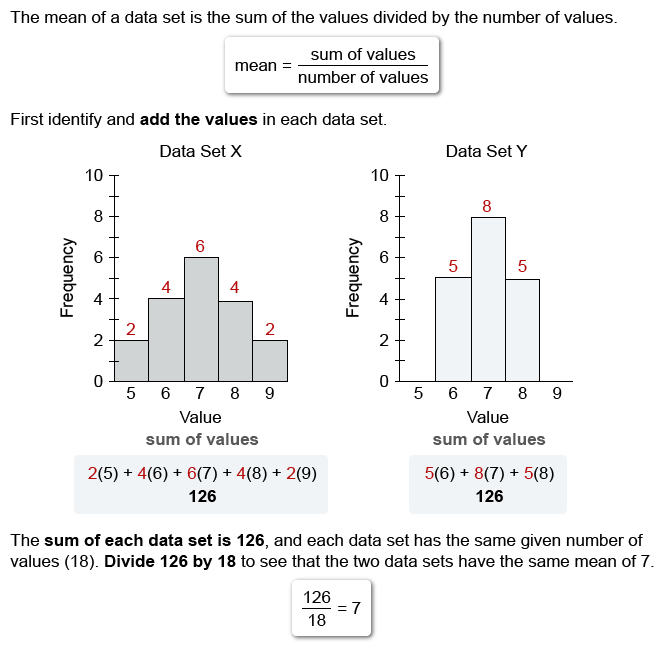
Data sets X and Y are shown in the graphs above. Each data set consists of 18 integers. Which of the following statements must be true?
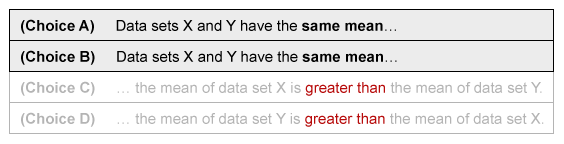
| A. Data sets X and Y have the same mean, but the standard deviation of data set X is greater than the standard deviation of data set Y. | |
| B. Data sets X and Y have the same mean, but the standard deviation of data set Y is greater than the standard deviation of data set X. | |
| C. Data sets X and Y have the same standard deviation, but the mean of data set X is greater than the mean of data set Y. | |
| D. Data sets X and Y have the same standard deviation, but the mean of data set Y is greater than the mean of data set X. |
Hint:
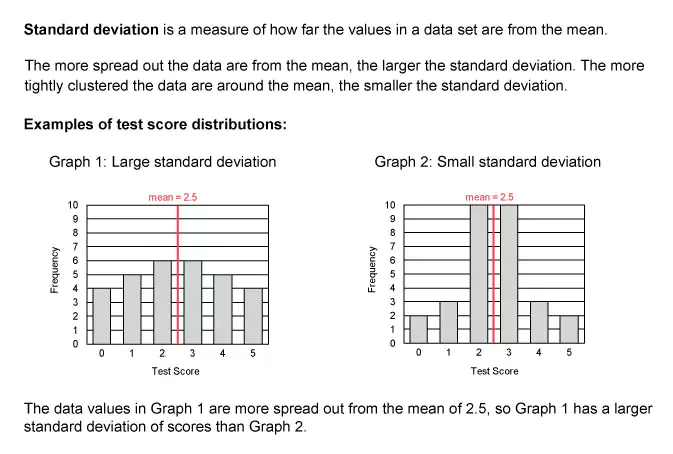
The standard deviation of a data set is a measure of how spread out the data points are from the mean.
Analyze each bar graph to determine how the mean and standard deviation of each data set compare. The horizontal axis gives the data values, and the vertical axis gives the number of those values in that set.
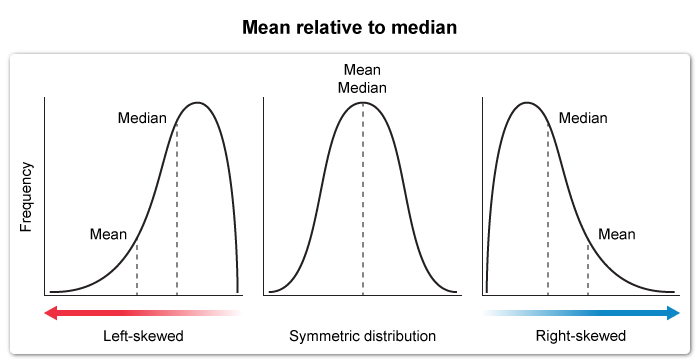
Notice that both graphs are symmetric. In a symmetric distribution, the mean and the median (or middle value) are equal. Each graph is symmetric about the same middle value (7), so the mean of each data set is equal to 7.
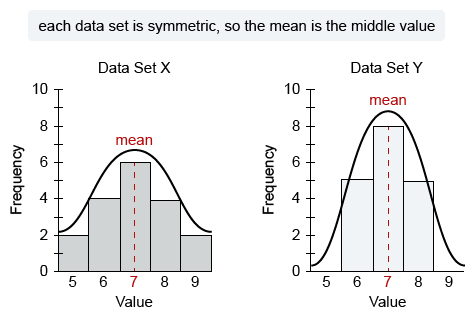
Eliminate Choices C and D because the data sets do not have different means.
The standard deviation (SD) of a data set is a measure of how spread out the data points are from the mean. The more the values are spread out from the mean, the greater the standard deviation.
Each mean is 7, so analyze how spread out the data points are from 7 in each graph.
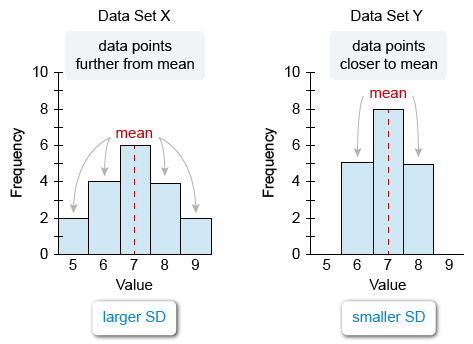
The data points of set X are further from the mean than the data points of set Y, so the standard deviation of data set X is greater than the standard deviation of data set Y. Eliminate Choice B.
Therefore, the statement in Choice A must be true: Data sets X and Y have the same mean, but the standard deviation of data set X is greater than the standard deviation of data set Y.
Note: It also is possible to use the mean formula to calculate the mean of each data set.
Things to remember:
- The standard deviation of a data set is a measure of how spread out the data points are from the mean. The more the values are spread out, the greater the standard deviation.
- In a symmetric distribution, the mean and the median are equal.
y = x2 + bx + c
In the equation above, b and c are constants. The graph of the equation in the xy-plane has x-intercepts at x = −4 and x = 11. What is the value of b ?
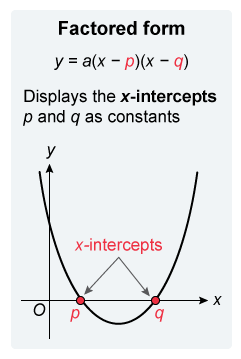
The given equation y = x2 + bx + c is a quadratic equation in standard form y = ax2 + bx + c, where scale factor a is 1. The x-intercepts x = −4 and x = 11 are given, so use factored form y = a(x − p)(x − q) to build an equation.
Plug in the scale factor a = 1 and the x-intercepts p = −4 and q = 11.
| y = a(x − p)(x − q) | Factored form |
| y = 1(x − (−4))(x − 11) | Plug in a = 1, p = −4, and q = 11 |
| y = (x + 4)(x − 11) | Simplify |
Now distribute each term in x + 4 to each term in x − 11 and combine like terms.
| y = (x + 4)(x − 11) | |
| y = (x)(x) + (x)(−11) + (4)(x) + (4)(−11) | Distribute |
| y = x2 − 11x + 4x − 44 | Multiply |
| y = x2 − 7x − 44 | Combine x-terms |
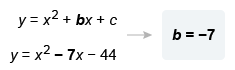
Now compare the resulting equation to the given equation to identify the value of b.
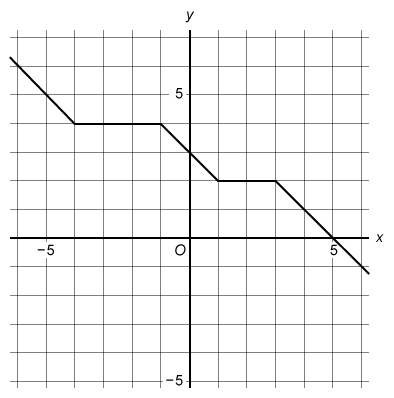
The complete graph of the function g is shown in the xy-plane above. What is the y-intercept of the graph of y = g(x − 3) ?
| A. (0, 0) | |
| B. (0, 2) | |
| C. (0, 3) | |
| D. (0, 4) |
Hint:
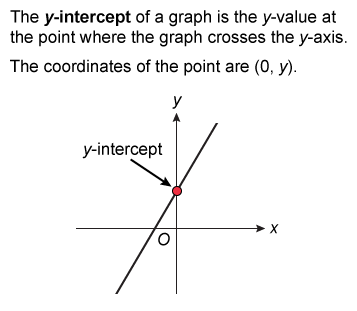
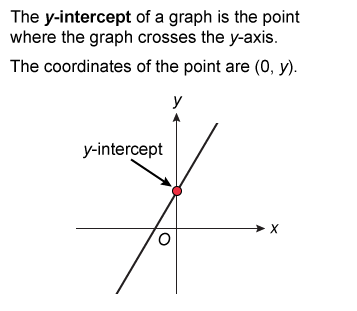
The y-intercept of a graph is the point where the graph crosses the y-axis.
Transform the given graph of g to get the graph of g(x − 3), and then find the y-intercept of the transformed graph.
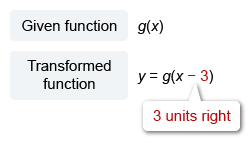
The function y = g(x − 3) is defined in terms of g(x), so it represents a transformation to the function g.
For any function f(x), the graph of y = f(x − h) + k is the graph of y = f(x) transformed by a horizontal shift of h units and a vertical shift of k units.
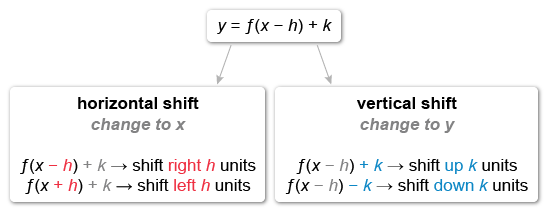
In y = g(x − 3), the number 3 is subtracted from the input x, so it represents a horizontal shift of 3 units to the right.
Therefore, the graph of y = g(x − 3) is the graph of y = g(x) shifted to the right 3 units. This means every point on the graph of g(x − 3) is 3 units to the right of every point on the graph of g(x).
Identify the point where the graph of y = g(x − 3) crosses the y-axis to determine the y-intercept.
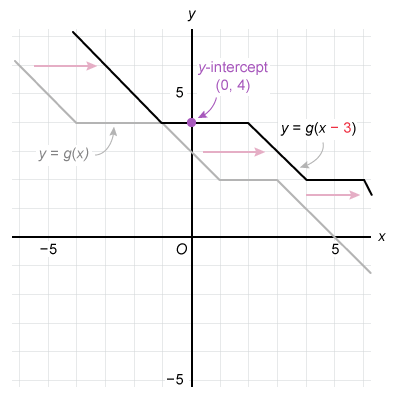
The graph of y = g(x − 3) crosses the y-axis at 4, so its y-intercept is (0, 4).
(Choice A) (0, 0) is the y-intercept of the graph of g(x) − 3, instead of g(x − 3).
(Choice B) (0, 2) is the y-intercept of the graph of g(x + 3), instead of g(x − 3).
(Choice C) (0, 3) is the y-intercept of the graph of g(x), instead of g(x − 3).
Things to remember:
- For any function f(x), the graph of y = f(x − h) + k is the graph of y = f(x) transformed by a horizontal shift of h units and a vertical shift of k units
- The y-intercept of a graph is the point where the graph crosses the y-axis, and it has an x-value of 0.
Alternate Method :
The y-intercept of a graph is the point where the graph crosses the y-axis, and it has coordinates (0, y).
The question asks for the y-intercept of the graph of y = g(x − 3), but the given graph shows y = g(x). First plug x = 0 into y = g(x − 3).
| y = g(x − 3) | |
| y = g(0 − 3) | Plug in x = 0 |
| y = g(−3) | Simplify |
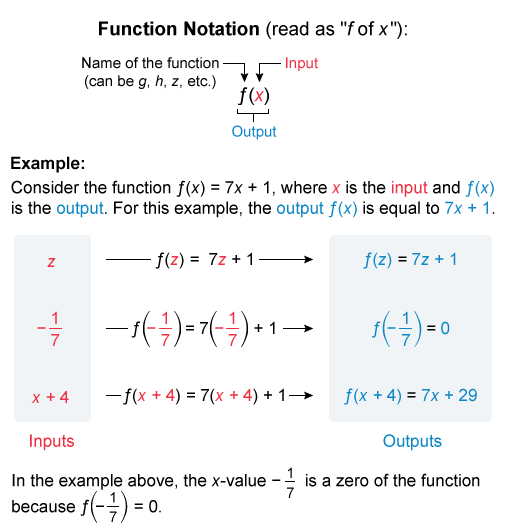
Therefore, the y-intercept of the graph of y = g(x − 3) has a y-value that is equal to the value of g(−3). The function notation g(−3) means the value of the function g when x is −3.
To identify the value of g(−3) from the given graph, find the y-value of the point where x = −3.
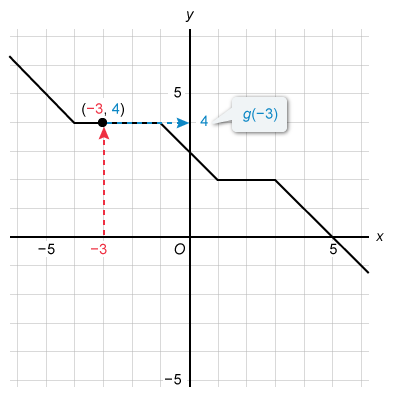
The value of g(−3) is 4. Therefore, the graph of g(x − 3) has y-intercept (0, 4).
Things to remember:
- The y-intercept of a graph is the point where the graph crosses the y-axis, and it has an x-value of 0.
- The function notation f(a) means the output (or value) of f(x) when the input is a.

Geometry and Trigonometry
This section asks a total of 5-7 questions (15%) on area, volume, parameters of lines, angles, circles, right triangles, and right triangle trigonometry.
Tricks and strategies to ace Geometry and Trigonometry
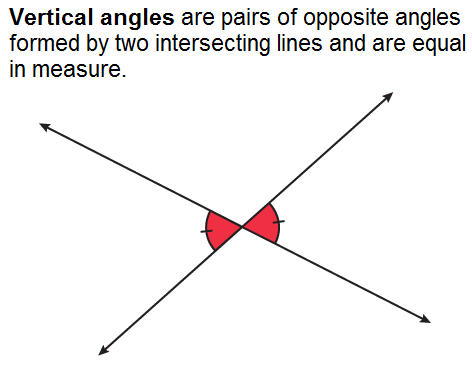
As geometry and trigonometry make up the core of this domain, familiarity with geometric rules, theorems, and trigonometry is vital. In particular, be sure you can recognize how angle values relate to each other within sets of parallel lines or triangles, noting which angles must be congruent (equivalent) or supplementary (adding up to 180 degrees). Circle theorems comprise a small portion of this section, so they do not appear on every exam. Still, many students need to familiarize themselves with how to arrive at the size and angles of a given circle, so once you're confident in the other categories, take time to memorize these applications.
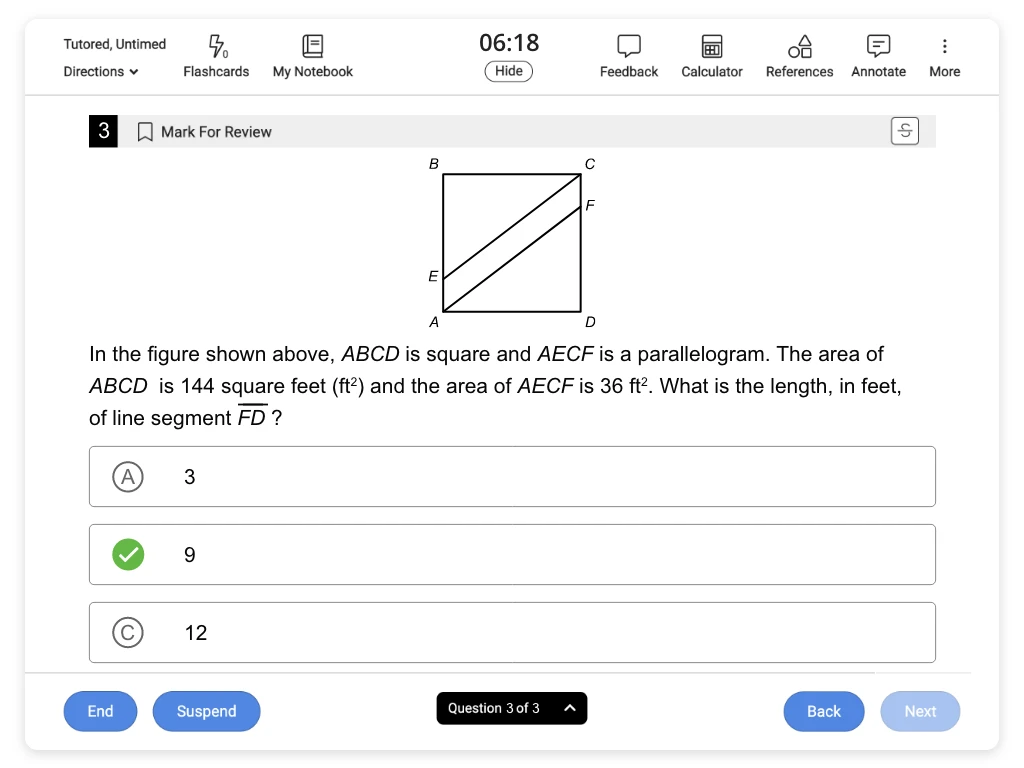
Geometry and Trigonometry in Math examples
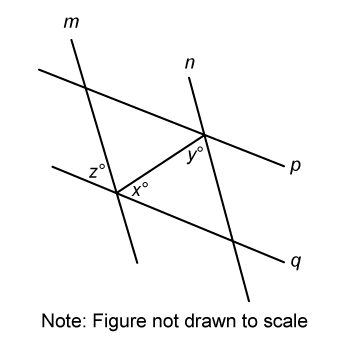
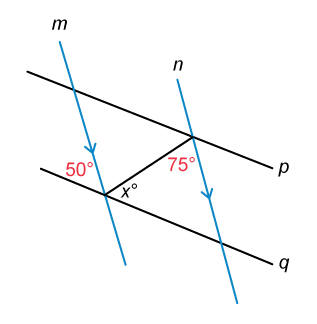
In the figure above, line m is parallel to line n. If y = 75 and z = 50, what is the value of x ?
| A. 50 | |
| B. 55 | |
| C. 60 | |
| D. 65 |
Hint:
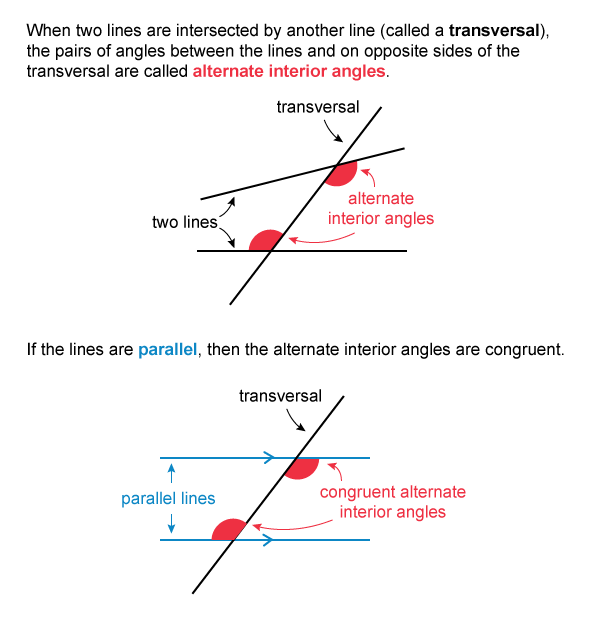
When parallel lines are intersected by a transversal, they form pairs of corresponding angles that are congruent.
First label the figure with the given information y = 75 and z = 50, as well as m || n.
When parallel lines are intersected a transversal, the pairs of corresponding angles that they form are congruent (equal in measure).
It is given that lines m and n are parallel, so the corresponding angles below must both measure 50°. Notice that the corresponding 50° angle is also the interior angle of a triangle along with the 75° and x° angles.
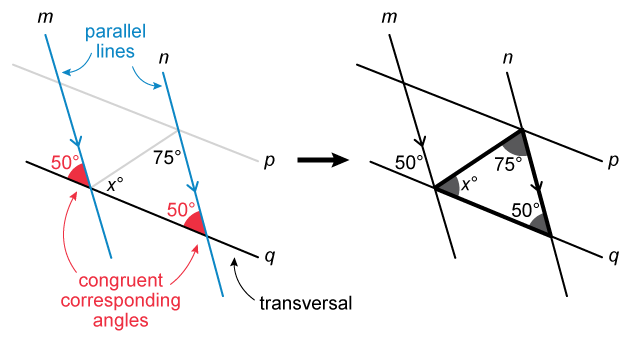
The measures of the interior angles of a triangle sum to 180°, so set the sum of these interior angle measures equal to 180 and solve for x.
| x + 75 + 50 = 180 | Sum of measures of interior angles of a triangle is 180° |
| x + 125 = 180 | Simplify |
| x = 55 | Subtract 125 from both sides |
(Choice A) 50 is a result of mistaking the z° and x° angles for vertical angles and therefore equal in measure.
(Choice C) 60 is a result of the mistaken assumption that the triangle is equilateral and therefore all interior angles are equal in measure.
(Choice D) 65 is a result of a subtraction error: 180 − 125 ≠ 65.
Things to remember:
- If parallel lines are cut by a transversal, the pairs of corresponding angles that they form are equal in measure.
- The measures of the interior angles of a triangle sum to 180°.
Alternative Method:
It is also possible to consider congruent alternate interior angles to find the value of x.
It is given that lines m and n are parallel, so the alternate interior angles below must both have a measure of 75°. Notice that the 50°, 75°, and x° angles combine to form a straight line (line q).
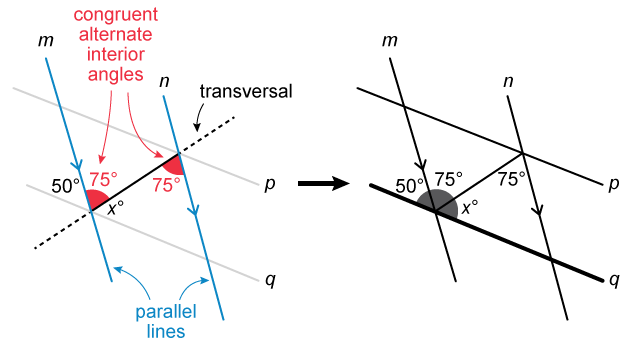
Angles that combine to form a straight line have measures that sum to 180°, so set the sum of these measures equal to 180 and solve for x.
| 50 + 75 + x = 180 | Angles that combine to form a straight line have measures that sum to 180° |
| 125 + x = 180 | Simplify |
| x = 55 | Subtract 125 from both sides |
Things to remember:
- If parallel lines are cut by a transversal, the pairs of alternate interior angles that they form are equal in measure.
- Angles that combine to form a straight line have measures that sum to 180°.
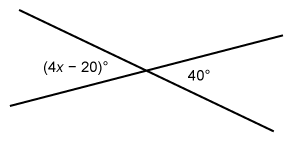
Two lines intersect as shown in the figure above. What is the value of x ?
Hint:
When two lines intersect, they form pairs of vertical angles that are equal in measure.
When two lines intersect, they form pairs of vertical angles that are equal in measure. The angles with measures (4x − 20)° and 40° are vertical angles, so set their measures equal and solve for x.
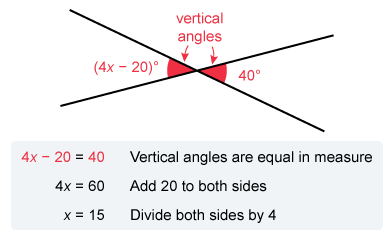
The value of x is 15.
Things to remember:
When two lines intersect, they form pairs of vertical angles that are equal in measure.
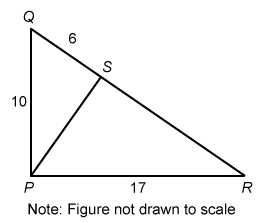
In the figure above, angles PSQ and PSR are right angles. What is the length of SR
Hint:
First use the Pythagorean theorem with right triangle PQS to find the length of segment PS.
It is given that angles PSQ and PSR are right angles, so triangles PSQ and PSR are right triangles. It is not given that ∠QPR is a right angle, so do not assume that ΔQPR is a right triangle.
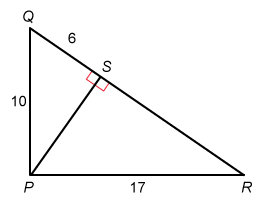
Find the length of PS first. The Pythagorean theorem states that a2 + b2 = c2, where a and b are the lengths of the legs of a right triangle with a hypotenuse of length c.
The legs of ΔPSQ are PS and QS, and the hypotenuse is PQ. Plug in a = PS, b = 6, and c = 10, then solve for PS.
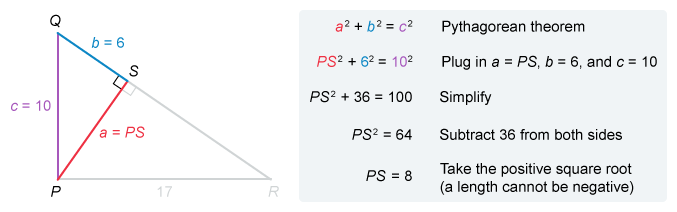
The length of PS id 8. Now that two side lengths of right triangle PSR are known, use the Pythagorean theorem again to solve for SR.
The legs of ΔPSR are PS and SR, and the hypotenuse is PR. Plug in a = 8, b = SR, and c = 17, then solve for BD.
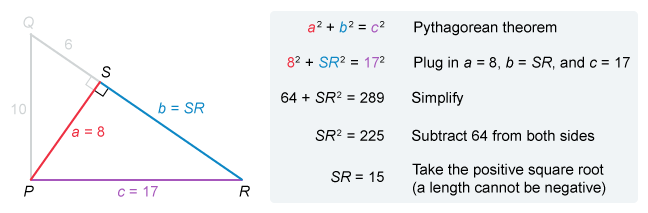
The length of SR is 15.
Things to remember:
The Pythagorean theorem states that a2 + b2 = c2, where a and b are the lengths of the legs of a right triangle and c is the length of the hypotenuse.
How To Fill Student-Produced Responses on Digital SAT Math
Most Digital SAT Math test questions come in the form of multiple-choice questions. However, some questions do not provide answer choices and require you to come up with an answer on your own. These types of questions are known as student-produced responses (SPRs), and students fill in their answers directly into the exam system. These questions evaluate your capacity to solve math problems independently with less guidance and structure than the multiple-choice format. SPR questions may offer multiple correct responses, but you must provide only one answer.
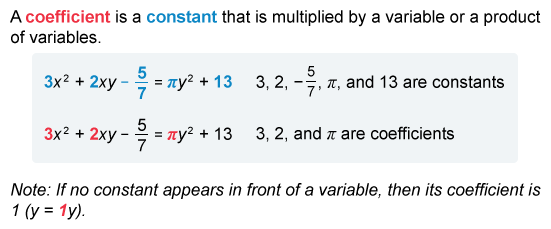
Key Takeaways
Studying for the Digital SAT Math Section can feel intimidating due to a lack of familiarity with the various question types. However, you can tackle these questions more easily by dividing them into the exam's four domains. As you practice each Digital SAT math category, study one domain at a time until you're comfortable and consistently answer related questions correctly. By arranging your study plan this way, you can master the subject one step at a time as the topics within a domain progressively build upon each other. This approach prevents you from overwhelming yourself by tackling the subject simultaneously.
Unfamiliar with the content for each domain, don't want to waste valuable practice time classifying the questions on your own, or simply prefer a more organized way to study the section? UWorld's Digital SAT Math QBank does this grouping for you. This invaluable tool allows you to easily build a test with rigorous questions and comprehensive answer explanations for each domain, one subsection at a time.
Frequently Asked Questions (FAQs)
What are the most common Digital SAT math problems types?
Algebra and Advanced Math domain questions constitute 13–15 questions, respectively. Consequently, the exam’s most prevalent SAT math question types are linear functions, inequalities, nonlinear equations, and nonlinear functions. Together these topics comprise 70% of the Digital SAT math section.
What common mistakes should I avoid while solving Digital SAT math problems?
Most Digital SAT Math mistakes, including those deemed “silly mistakes,” occur due to stress, unfamiliarity with how to approach a problem type or time mismanagement. The most effective approach to preventing these common errors is to practice with realistic practice questions of varying difficulty levels. Take the time to identify potential traps in the questions and possible answers, then write out your step-by-step process for each problem. As you become more familiar with a particular question type, you will naturally refrain from misreading parts of the question or falling into common miscalculation traps.
What should I do if I get stuck on a particularly difficult Digital SAT math problem?
Remember that each question carries equal weight in your score, so focus on answering the questions you feel more confident about first. Due to the limited time allocated for each Digital SAT math question (approximately a minute and a half, on average), don’t be afraid to skip questions if you don’t know where to begin or feel you’d only be able to answer after a lengthy multi-step process. Once you finish the questions you’re more comfortable with, you can return to the challenging questions with less pressure.
If you encounter a challenging question while practicing, study its explanation and note it for later review (if you’re practicing with UWorld) or discuss it with peers, a tutor, or your math teacher. When possible, follow up with this process by answering similar questions; in doing so, you’ll apply the lessons you learned from the first explanation and cement those methods into your memory.
Are there any shortcuts or tricks for quickly solving Digital SAT math problems?
While not all math question types have shortcuts, there are strategies and formulas that can help reach solutions quickly. Many of these techniques are question-type-specific, so check out the explanations in our Digital SAT Math QBank for myriad examples of strategies and when to apply them. Additionally, engage in regular practice with your calculator or the integrated digital calculator to become adept at determining when to utilize it and mastering its specific functions.