The SAT® Writing test includes questions that require your skills in interpreting information from a graphic. These graphics can be tables, charts, or graphs, so you must understand how to read the information presented in any of these formats.
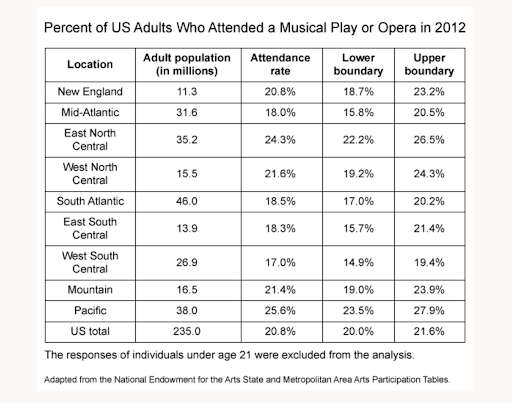
The following graphics can give you an idea of what to expect.
Each graphic will be accompanied by a passage. You will find questions that ask you to read the information presented in the graphic, find correlations between the graphic and the passage, find evidence in the passage that supports data in the graphic, find data in the graphic that supports the passage’s claims, and make decisions about the graph’s relevance.
Most questions related to SAT Writing passages are formatted like this:
- Select an answer.
- NO CHANGE
- ______
- ______
- ______
Graphic questions are specific. You will look directly to the passage and the surrounding contexts to make decisions when tasked with editing and finding improvements to the expression of ideas, command of evidence, word choice, punctuation use, and sentence structure.
For graphing questions, you must use information in the text and the graphic to edit and improve the quality of writing.
Some questions ask, What does the graphic say?
- Example: Which answer choice represents the data in the graph most accurately?
Others ask you to read the graphic and answer, Does the graphic support the text? or Does the text support the graphic?
- Example: Based on the graph, does the [measurement of something] change or stay the same over time, and which claim from the passage effectively supports this information?
You may also see questions that require you to read the graphic and answer, Does the graphic provide evidence that is relevant to the author’s claims?
- Example: The author wants to add a sentence with information that supports the paragraph’s main point. Which answer choice most effectively completes the paragraph using data based on the table below?
Pay attention to details while reading a graphic. Be sure that you are aware of the units of measurements and the details in a legend or key. You should also pay attention to what each axis represents.
When answering questions that require your understanding of both the graphic and the passage, be sure that you recognize and make note of details in both formats. Look at the location in question, and make sure that the graphic’s data is relevant to the passage’s claims and the contextual information.
As you prepare for the SAT Writing test, especially SAT Writing passages, practice work is crucial. If you don’t have experience analyzing data graphics, be sure to familiarize yourself with the kinds of tables, graphs, and charts you will find on the SAT test. UWorld’s SAT Prep Course has thousands of practice questions that are realistic in style and difficulty to the official SAT test.
Spend time with these questions and take advantage of the performance tracking tools and answer explanations that are also offered in the prep course. You can use these performance tracking tools to learn which sections, subsections, and question types you can improve the most.
You can use the answer explanations to learn from your mistakes. Try it out to maximize your score in this question type!