
2 studies of 6 trials each were performed with several pendulums consisting of various lengths and bobs.
In each trial, the following occurred: First, a string having a length of L was attached to a bob of mass mb. Next, the end of the string opposite the bob was attached to a pivot point to create a pendulum. Then, using a protractor attached to the pivot point, the bob was pulled back to a selected displacement angle θ and the bob was released. Figure 1 illustrates the sequence of events, beginning with the string at a selected θ.
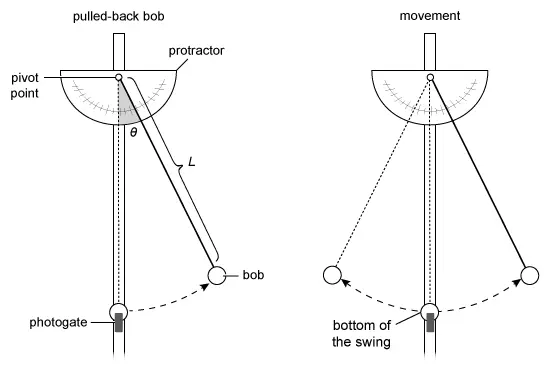
Figure 1
The values for kinetic energy (KE) and velocity (v) at the bottom of the swing (the lowest point of the bob during its movement) were determined using values recorded by a photogate placed below the pivot point. Values for the period T (the time of 1 full cycle of the pendulum from its starting position) were determined using a stopwatch.
Study 1
In Trials 1–6, various combinations of L and mb were set while θ equaled 40°. Table 1 shows the values of KE (in joules, J) and v at the bottom of the swing for each trial and the value of T.
| Trial | L (m) | mb (kg) | KE (×10-5 J) | v (m/s) | T (s) |
|---|---|---|---|---|---|
| 1 | 0.10 | 0.10 | 2.29 | 0.68 | 0.63 |
| 2 | 0.20 | 0.10 | 4.59 | 0.96 | 0.90 |
| 3 | 0.30 | 0.10 | 6.88 | 1.17 | 1.10 |
| 4 | 0.10 | 0.20 | 4.59 | 0.68 | 0.63 |
| 5 | 0.10 | 0.30 | 6.88 | 0.68 | 0.63 |
| 6 | 0.10 | 0.40 | 9.17 | 0.68 | 0.63 |
Study 2
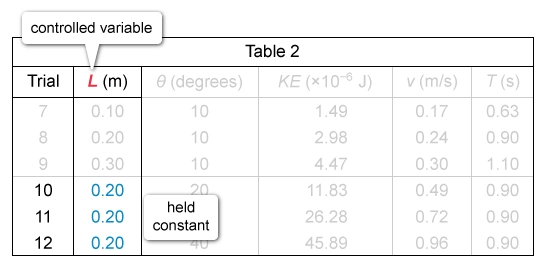
In Trials 7–12, various combinations of L and θ were set while mb equaled 0.1 kg. See Table 2.
| Trial | L (m) | θ (degrees) | KE (×10-6 J) | v (m/s) | T (s) |
|---|---|---|---|---|---|
| 7 | 0.10 | 10 | 1.49 | 0.17 | 0.63 |
| 8 | 0.20 | 10 | 2.98 | 0.24 | 0.90 |
| 9 | 0.30 | 10 | 4.47 | 0.30 | 1.10 |
| 10 | 0.20 | 20 | 11.83 | 0.49 | 0.90 |
| 11 | 0.20 | 30 | 26.28 | 0.72 | 0.90 |
| 12 | 0.20 | 40 | 45.89 | 0.96 | 0.90 |
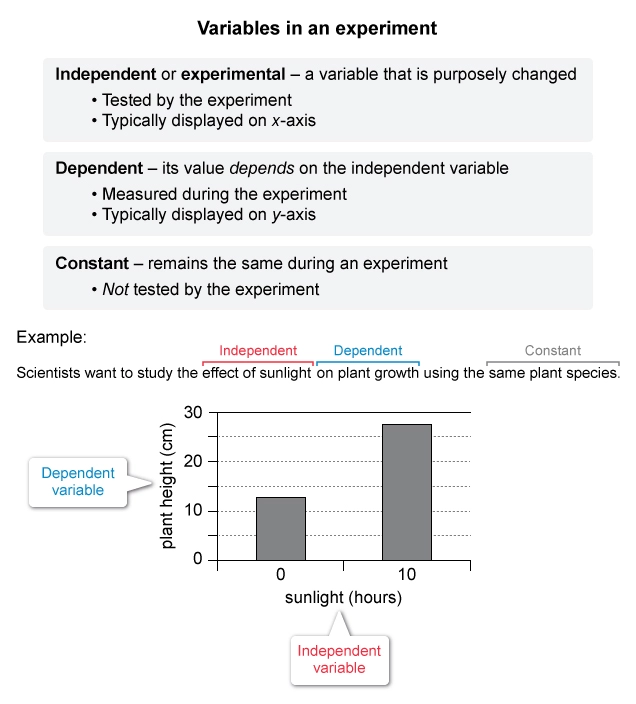
A variable that was purposely kept constant during a set of trials and was not measured is called a controlled variable. What were the 2 controlled variables in Trials 10–12?
-
L and T
-
mb and L
-
mb and θ
-
θ and T
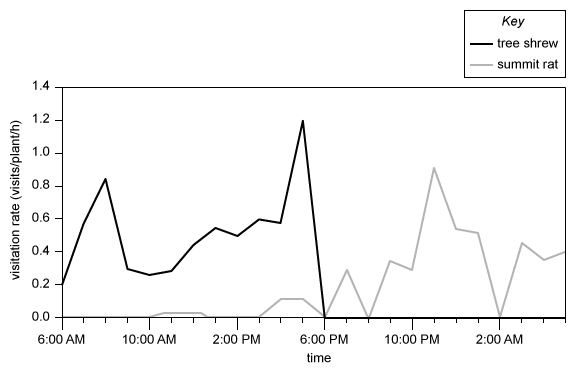
Researchers discovered that some pitcher plants have adapted to a mutualistic relationship (when members of different species benefit each other) with 2 members of the class Mammalia. In a study of pitcher plants (Nepenthes rajah), researchers compared the scat (animal feces) from tree shrews (Tupaia montana) and summit rats (Rattus baluensis) inside and outside the pitcher plant. Figure 1 shows 2 locations of scat in relation to a pitcher plant (inside and outside). Figure 1 also shows, for each of the animals and locations, daily deposit rates of scat.
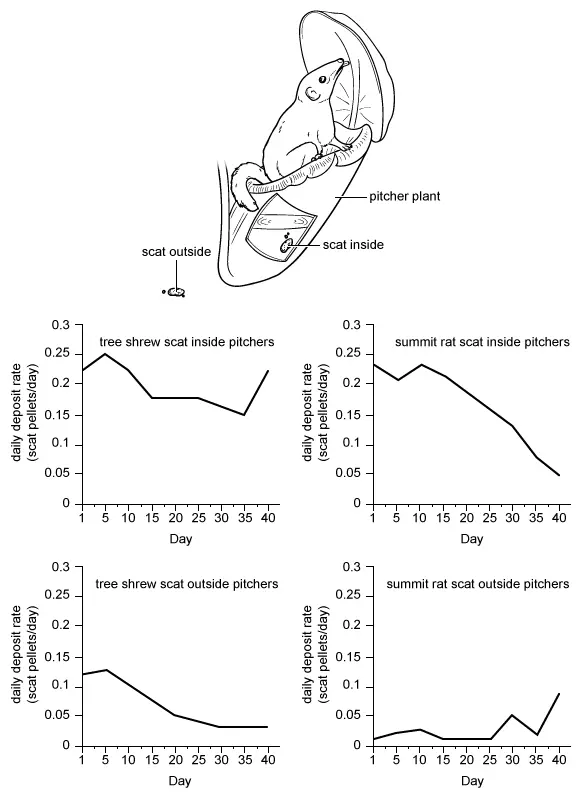
Figure 2 shows tree shrew and summit rat visitation rates to pitcher plants per time of day over a complete day.
Which of the following variables was kept constant in this study?
-
Scat type
-
Daily visitation rate of summit rats
-
Species of pitcher plant
-
Daily visitation rate of tree shrews
Phthalates are chemicals that are added to plastics to make them soft and flexible. Because phthalates are not chemically bound to the plastics to which they are added, they can be released into the environment. Two experiments examined how the shape and concentration of iron oxide (Fe2O3) nanoparticles affect the degradation (chemical breakdown) of environmental dibutyl phthalate (DBP) upon exposure to light and hydrogen peroxide (H2O2).
Experiment 1
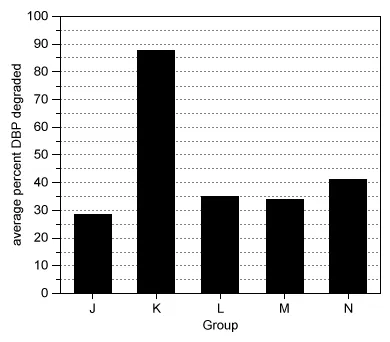
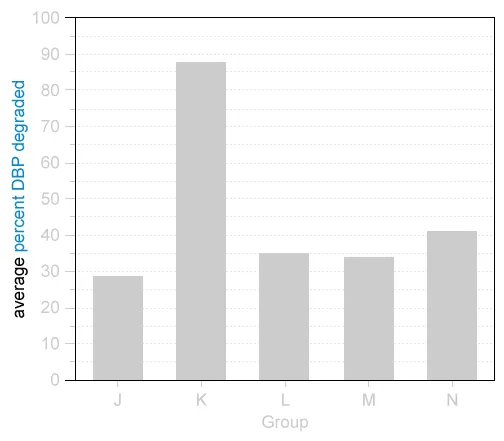
Each of 15 identical beakers received 100 mL of a DBP solution with a concentration of 13 mg/L. The beakers were equally divided into 5 groups (Groups J–N). For each group of beakers, Fe 2O3 nanoparticles with 1 of 5 different shapes were added to achieve a nanoparticle concentration of 0.30 mg/mL (see Table 1).
| Group | Shape |
|---|---|
| J | flake |
| K | hollow |
| L | walnut |
| M | shuttle |
| N | burger |
Each beaker then received 50 microliters (µL) of H2O2 and was placed on a magnetic stirrer located 20 cm from a 250 W light source. After 60 min, the concentration of DBP in each beaker was measured, and the average percent DBP degraded in each group was calculated (see Figure 1).
Experiment 2
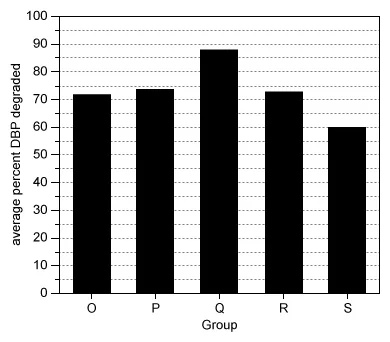
Each of 15 identical beakers received 100 mL of a DBP solution with a concentration of 13 mg/L. The beakers were then equally divided into 5 groups (Groups O–S). Each beaker received 50 µL of H2O2 and was placed on a magnetic stirrer located 20 cm from a 250 W light source. For each group of beakers, hollow-shaped Fe2O3 nanoparticles were then added at 1 of 5 different nanoparticle concentrations (see Table 2).
| Group | Nanoparticle concentration (mg/mL) |
|---|---|
| O | 0.20 |
| P | 0.25 |
| Q | 0.30 |
| R | 0.35 |
| S | 0.40 |
After 60 min, the average percent DBP degraded in each group was determined as in Experiment 1 (see Figure 2).
For any group, the value shown in Figure 1 was most likely calculated using which of the following expressions?

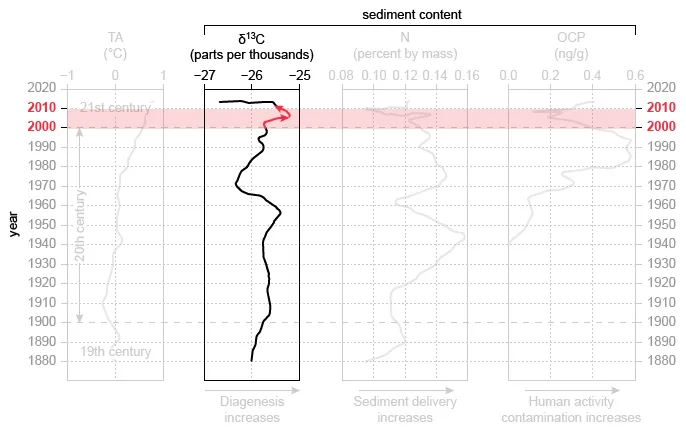
With a combination of historical and contemporary data sets, Lake Hazen, Canada's largest and northernmost lake, can be used to study the ecological impact of temperature anomalies (TAs), unexpected changes in temperature. TAs for the northern hemisphere were calculated over the past 135 years A sediment core from the lakebed of Lake Hazen was analyzed for a stable isotope of carbon (δ13C), nitrogen (N), and organochlorine pesticides (OCP). The parts per thousand of δ13C, the percent by mass of N, and the concentration of OCP indicate the degree of diagenesis, sediment delivery, and human activity contamination, respectively (3 measures of ecological impact), over the past 135 years. The results are shown in the figure.
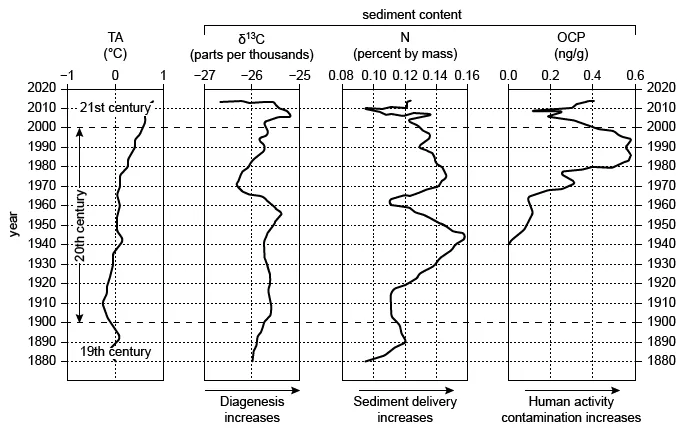
Over which of the following periods did the stable isotope of carbon both increase and decrease?
-
1880–1900
-
1930–1940
-
1960–1970
-
2000–2010

Organic molecules contain carbon atoms and are critical to life. Their presence on Mars can be explained by either biotic or abiotic processes.
Biotic processes are associated with the chemical reactions carried out by living organisms. These reactions allow the organisms to obtain energy, grow, and reproduce. Such reactions result in the production of organic molecules like proteins.
Abiotic processes are not associated with the activities of living things. Interactions between nonliving factors in the environment can result in the production of certain organic molecules. Methane (CH 4) is an organic molecule that can be produced by chemical reactions that occur between certain minerals and water under appropriate temperature and pressure conditions. Two abiotic processes that can produce organic molecules are shown in Figure 1.
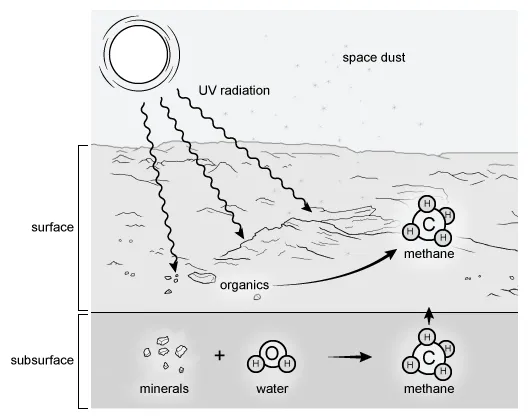
Figure 1
Two scientists present their viewpoints about the abiotic origin of organic molecules on Mars.
Scientist A
The Curiosity rover from NASA's Mars Science Laboratory mission has detected various organic molecules on Mars, including methane and chlorobenzene. Tests conducted by the rover have shown that the concentration of methane in the atmosphere of Mars varies with location and time. The rover has detected spikes in methane concentration in which the concentration showed a tenfold increase for brief periods of time and then decreased again. A sharp spike in methane concentration is consistent with methane being produced in a specific localized area. Geologic processes on Mars could produce the conditions necessary for reactions to occur between minerals and water, resulting in localized spikes in methane concentration. The flow of the liquid water required for these reactions is demonstrated by the dark streaks observed on the surface of Mars.
Scientist B
Liquid water does not exist on Mars, and the geologic conditions necessary to produce methane from reactions between minerals and water are not present there. The dark streaks observed on the surface of Mars are due to wind-blown sand and dust slipping down steep slopes. The organic molecules that exist on Mars were delivered to the surface of Mars in comets, meteorites, and dust from space. Ultraviolet (UV) radiation interacts with these organic molecules on the planet's surface, resulting in the production of methane that moves up into the atmosphere. Localized spikes in methane concentration are due to increased delivery of organic molecules to Mars during meteor showers.
Which of the following topics is discussed by Scientist B but not by Scientist A?
-
The occurrence of methane concentration spikes on Mars
-
The production of methane from exposure of organic molecules to UV radiation
-
The flow of liquid water on Mars
-
The addition of organic molecules to the surface of Mars by microorganisms


