
AP Macroeconomics Practice Test: Basic Economic Concepts
Question
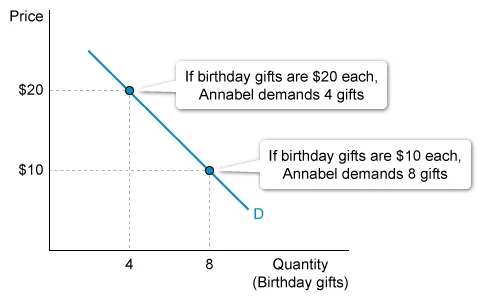
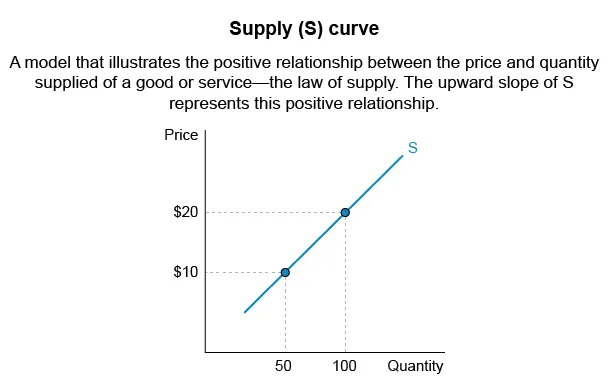
Annabel prefers to buy her family members' birthday gifts in January when many stores have sales. Annabel's shopping preference can be illustrated by
| A. an upward movement along the supply curve | |
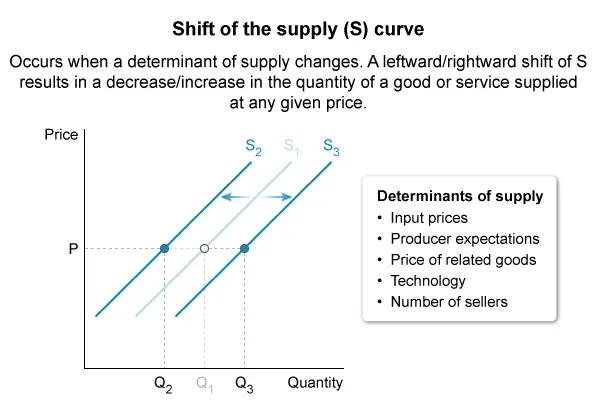
| B. a rightward shift of the supply curve | |
| C. a leftward shift of the demand curve | |
| D. a rightward shift of the demand curve | |
| E. a downward movement along the demand curve |
Explanation:
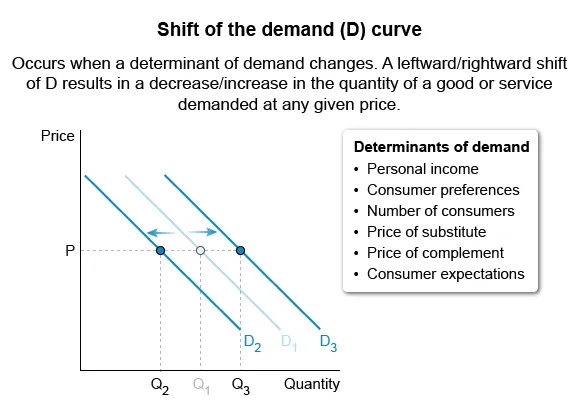
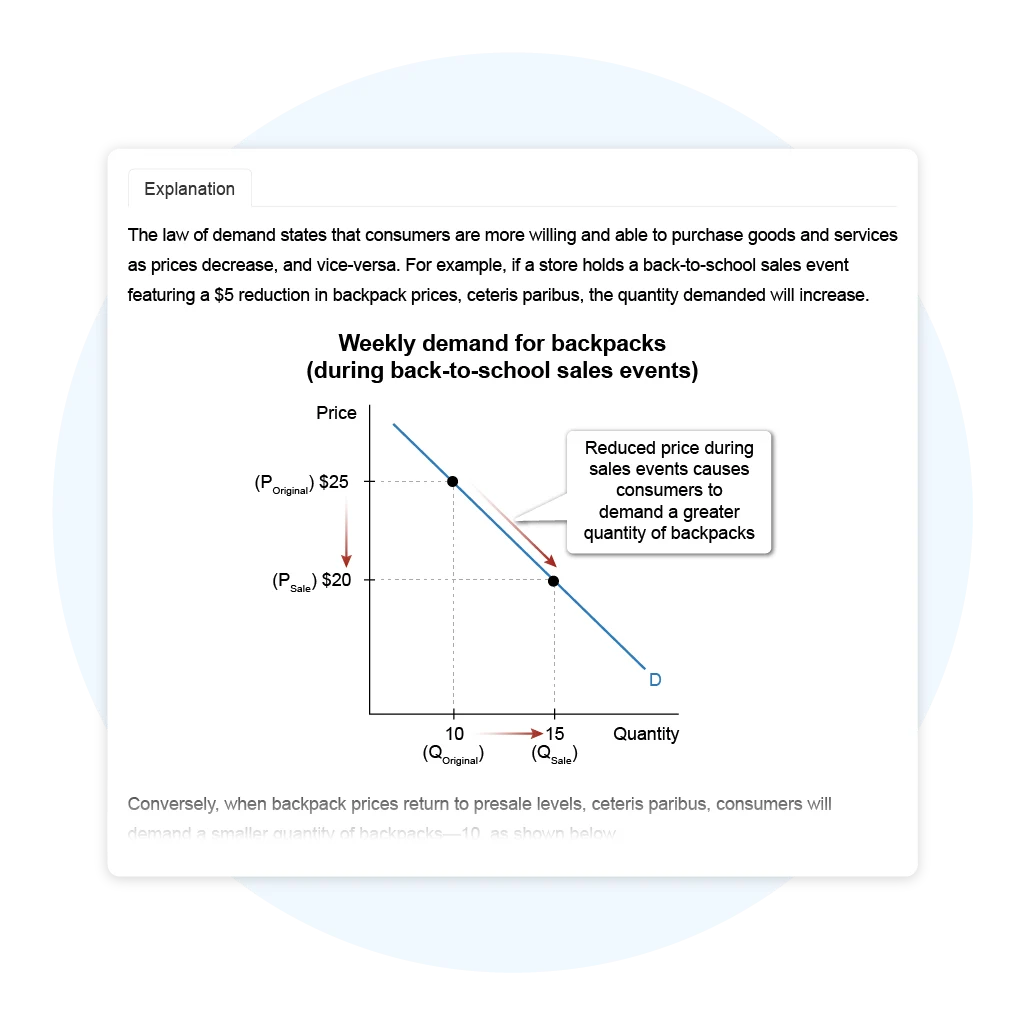
A demand curve illustrates the law of demand—consumers will buy more of a good when the price falls and will buy fewer goods when the price increases. Annabel's demand for birthday gifts can be illustrated by the demand curve below:
Annabel's shopping preference—to purchase more birthday gifts when the price is lower—is illustrated by a downward movement along a demand curve.
(Choices A and B) Because Annabel's shopping preference to buy goods on sale represents demand, her preference is illustrated by a demand curve, not a supply curve.
(Choices C and D) A decrease in a good's price will not cause a demand curve to shift, but instead will cause a downward movement along a demand curve.
Things to remember:
A demand curve illustrates the law of demand—the inverse relationship between price and quantity demanded.
Question
Assume that a nation specializes in the production of phone chargers instead of phone cases. It can be concluded that
| A. the opportunity cost to produce phone chargers will decrease as the nation continues to produce them | |
| B. the nation's trade partners can produce phone chargers at a lower opportunity cost | |
| C. the nation can produce more phone chargers than its trade partners | |
| D. the nation has an absolute advantage in producing phone chargers | |
| E. the nation's consumption opportunities will increase if it trades phone chargers for phone cases |
Explanation:
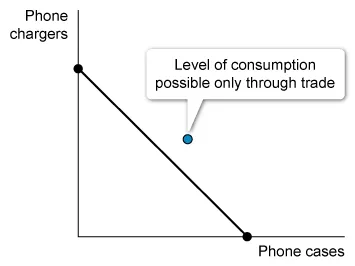
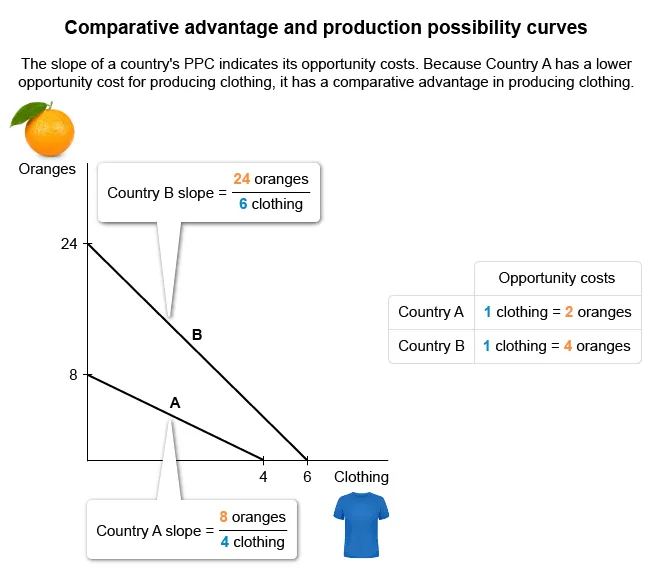
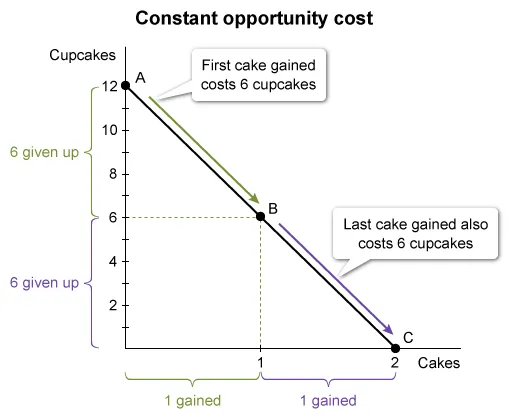
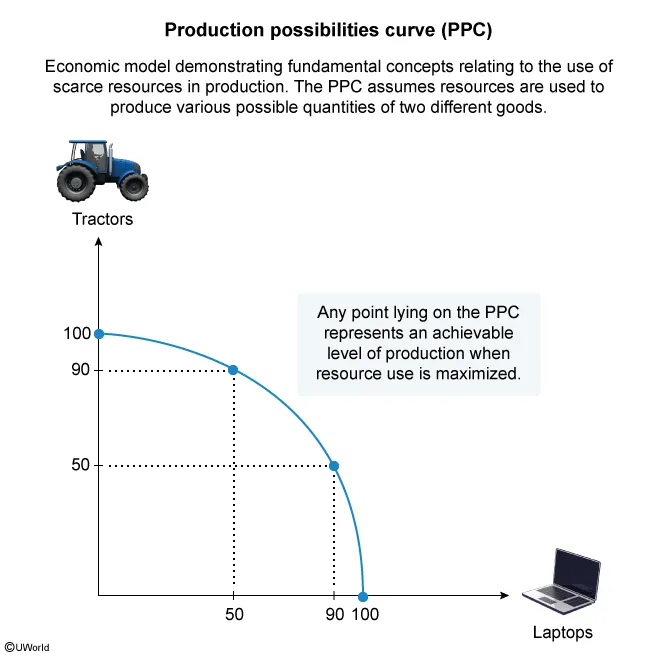
The production possibilities curve (PPC) illustrates an economy's opportunity costs of production and, when compared with another economy's PPC, can show comparative advantages. A nation with a comparative advantage in producing a certain good can benefit by specializing in that good's production and trading for a good that another nation specializes in producing.
Such trade allows a nation to consume more than it can produce; increased consumption opportunities are gains from trade that can be shown by a point lying outside the PPC. For example, if a nation specializes in phone charger production, its consumption opportunities will increase beyond its PPC if it trades phone chargers for phone cases, as shown in the image.
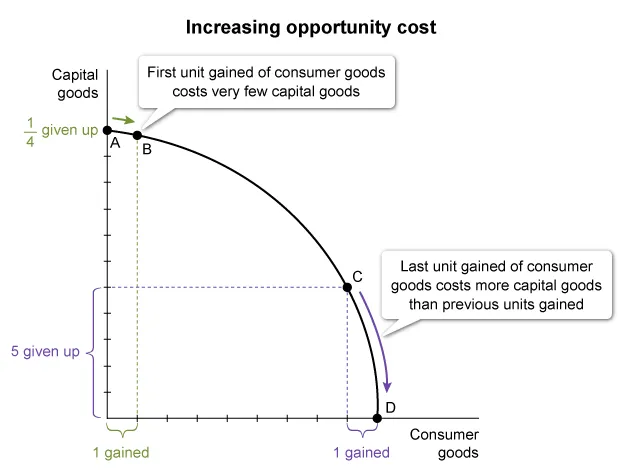
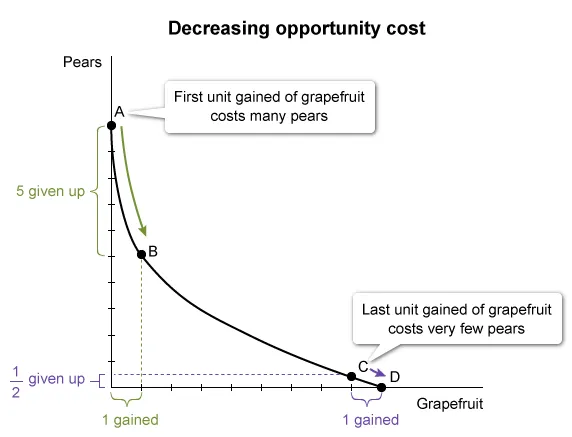
(Choice A) Opportunity costs can increase, decrease, or remain constant; the question doesn't provide enough information to conclude which of these will occur.
(Choice B) A nation specializes in phone charger production because that nation, not its trade partners, has a lower opportunity cost to produce that good.
(Choices C and D) A nation that specializes in producing a particular good might or might not be able to produce more of that good than its trading partners. An absolute advantage in producing phone chargers can be identified only by evaluating the number of chargers each nation produces, which is not provided in the question.
Things to remember:
A nation gains consumption opportunities beyond its production possibilities curve by specializing in the production of the good for which it has a comparative advantage and trading that good with another nation.
AP Macroeconomics Practice Test: Economic Indicators and the Business Cycle
Question
Which of the following is used in the income approach of measuring a country's gross domestic product?
| A. The number of jobs created | |
| B. The value of exports minus imports | |
| C. The total sum of transfer payments | |
| D. The cost of intermediate goods | |
| E. The dollar amount of interest paid |
Hint:
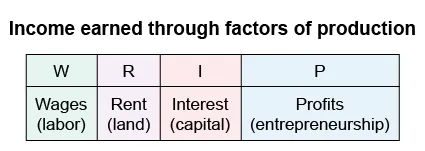
The factors accounted for by the income approach to GDP are represented in the formula: GDP = W + R + I + P
Explanation:
A country's gross domestic product (GDP) is the total value of all final goods and services it produces within a given period. GDP is often calculated using the expenditure approach, but GDP can also be calculated using the income approach.
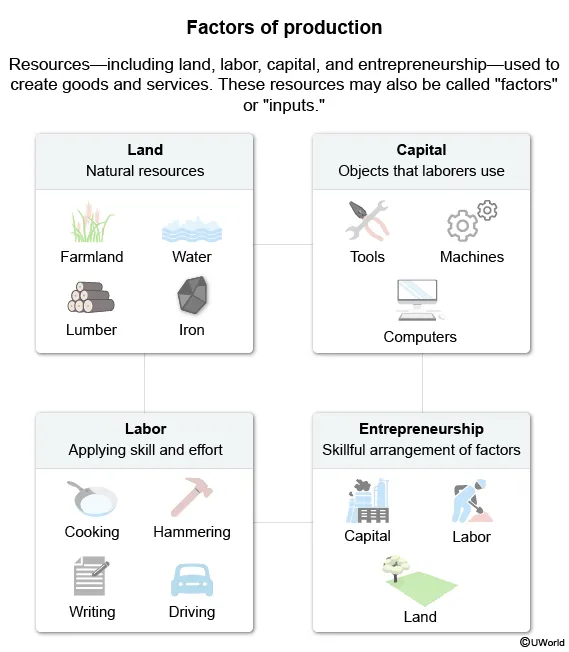
The income approach accounts for total income earned through factors of production. This approach sums income from wages for labor, rent for land, interest from capital, and profits from entrepreneurship (GDP = W + R + I + P).
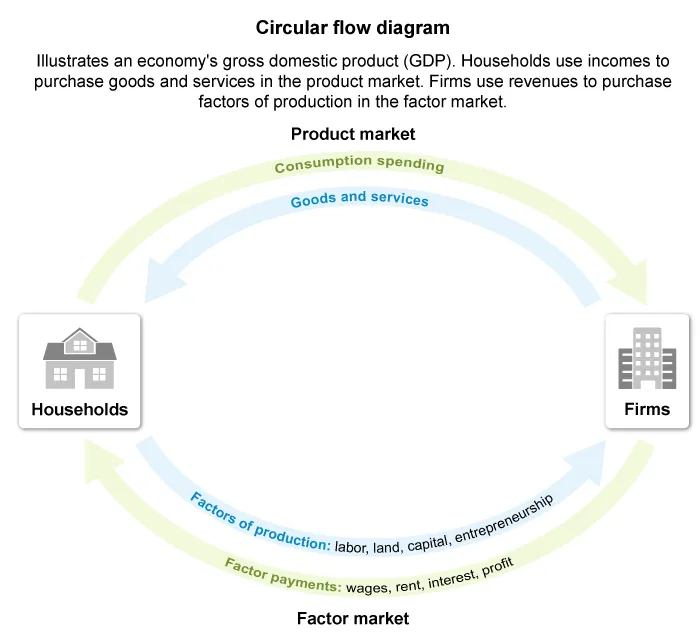
Capital is the machinery and other man-made resources needed to supply a good or service, such as all ovens that businesses use to make pizza. Producers borrow money to obtain capital. In the circular flow model, money for capital is lent to firms by households in the factor market. Firms pay interest on the loans, which is household income. The income approach to GDP accounts for the dollar amount of interest paid on capital.
(Choice A) The number of jobs created is not a part of calculating GDP.
(Choice B) Net exports are accounted for in the expenditure approach, not the income approach.
(Choice C) The government pays transfer payments to individuals for reasons other than labor or the purchase of goods or services; these payments are not accounted for in GDP.
(Choice D) The cost of intermediate goods is a factor accounted for by the value-added approach to GDP.
Things to remember:
The income approach to GPD accounts for income earned by households that supply firms with factors of production, including the dollar amount of interest paid on borrowed capital.
Question
In an economy, the unemployment rate is falling and real gross domestic product is rising. Which of the following must be true of the economy's position in the business cycle?
| A. The economy is in a recession and has not yet reached a trough | |
| B. The economy is in a recession and is producing less than potential output | |
| C. The economy is in an expansion and is producing more than potential output | |
| D. The economy is at a trough and will begin to expand | |
| E. The economy is in an expansion and has not yet reached a peak |
Explanation:
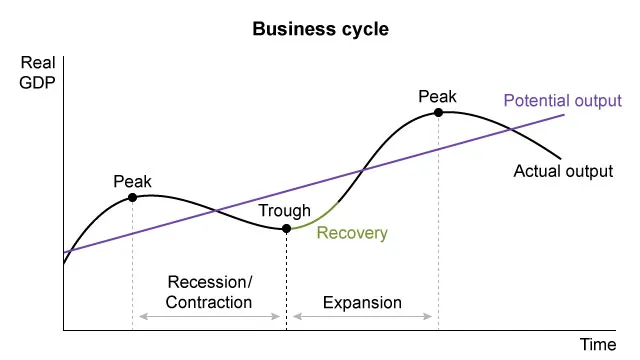
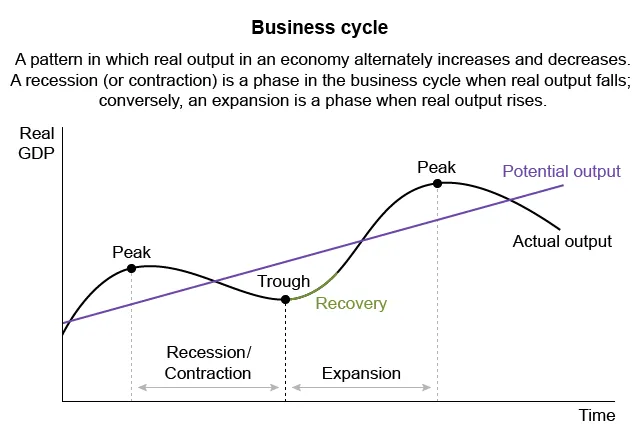
Economies experience alternating periods of increasing and decreasing real gross domestic product (GDP)—a measure of national output—called the business cycle. Periods of declining economic output (recession) coincide with increasing unemployment as companies lay off unneeded workers. After reaching a trough, the economy enters a recovery, and these trends reverse.
The economy then begins an expansion, where economic activity increases until it reaches a peak, after which the cycle repeats. Because national output increases during an expansion, firms hire more workers and unemployment falls. If national output is increasing and unemployment is falling, the economy has not yet reached the peak of the expansion.
(Choices A and B) In a recession, economic activity decreases, real GDP falls, and unemployment rises.
(Choice C) An increase in real GDP and a decrease in unemployment characterize an economic expansion, but the relationship of actual output to potential output cannot be determined from the given information.
(Choice D) A trough is a turning point in the business cycle, but at a point where real GDP has not yet begun to rise and the unemployment rate has not yet begun to fall.
Things to remember:
The phases of a business cycle include expansions that end at a peak and recessions that end at a trough.
Question
An output gap occurs when
| A. actual output differs from potential output | |
| B. a good's actual price rises above the market equilibrium price | |
| C. nominal output differs from real output | |
| D. the quantity supplied of a good exceeds the quantity demanded | |
| E. the production possibilities curve shifts outward |
Explanation:
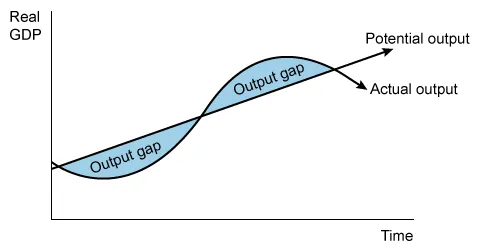
An economy's actual output fluctuates, reflecting changes in macroeconomic factors such as aggregate demand and cyclical unemployment. This fluctuation is illustrated on a business cycle diagram, which shows actual output moving toward and away from potential output over time. Therefore, output gaps occur when actual output differs from potential output.
(Choices B and D) An output gap accounts for economy-wide output, not the price or supply of a particular good.
(Choice C) Output gaps are characterized by changes in real GDP; they do not track changes in nominal GDP.
(Choice E) An outward shift of the production possibilities curve, which illustrates potential output, would not necessarily result in an output gap. For example, if the economy had a positive output gap and potential output increased, this increase could close the gap rather than create one.
Things to remember:
An output gap occurs when actual output differs from potential output.
AP Macroeconomics Practice Test: National Income and Price Determination
Question
After a peak in the business cycle, a nation is most likely experiencing
| A. lower inflation and an increase in aggregate supply | |
| B. a decrease in output and an increase in investment | |
| C. an increase in incomes and a decrease in aggregate supply | |
| D. an increase in exports and an increase in aggregate demand | |
| E. a decrease in consumer spending and a decrease in employment |
Explanation:
A peak in a nation's business cycle is the point when an expansion ends and a contraction begins. As a recession takes hold, businesses and consumers tend to become more cautious and spend less money. In addition, consumers' growing concerns about job security cause a decrease in consumer spending.
As consumer spending slows, decreasing aggregate demand, businesses tend to lay off staff and cut costs to remain profitable. This situation then reduces the quantity of national output supplied. Therefore, regardless of the depth and duration of a downturn of the business cycle, a nation in a recession will likely experience a decrease in consumer spending and employment.
(Choice A) Although inflation lowers after a peak, the total quantity of aggregate supply decreases, not increases.
(Choice B) Because output decreases during recessions, investment is likely to decrease, not increase, during the downturns.
(Choice C) Along with a decline in aggregate supply, incomes are likely to decrease, not increase, during recessions.
(Choice D) After a peak, exports may or may not increase, but aggregate demand will definitely decrease.
Things to remember:
Regardless of the depth and duration of a contraction, a nation typically experiences a decrease in employment and a decrease in consumer spending during recessions.
Question
A rightward shift of the long-run aggregate supply curve indicates an increase in
| A. potential output | |
| B. the price level | |
| C. consumption | |
| D. input prices | |
| E. government transfers |
Explanation:
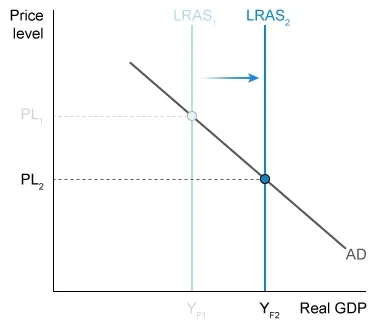
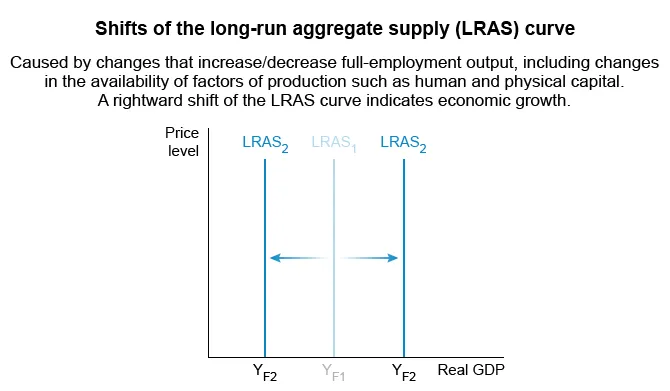
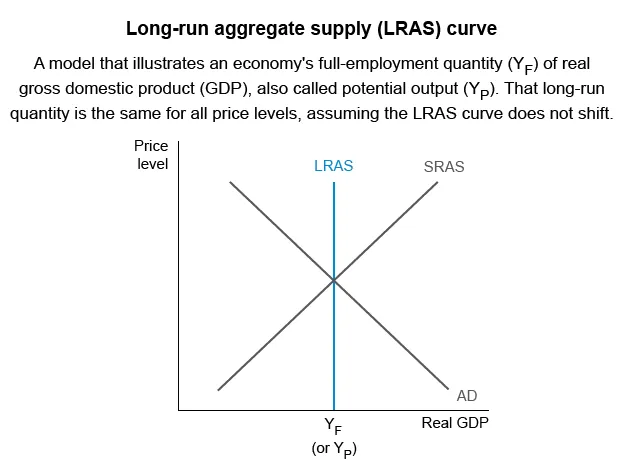
Long-run aggregate supply (LRAS) is an economy's potential output when its resources are fully employed. Potential output increases (YF1 to YF2) as the long-run aggregate supply curve shifts rightward (LRAS1 to LRAS2).
(Choice B) Assuming LRAS increases and there is no change in aggregate demand (AD), the price level decreases (PL1 to PL2), not increases.
(Choice C) Increased consumption shifts AD rightward but doesn't correspond to a shift of LRAS.
(Choices D and E) Changes in input prices and government transfers affect short-run aggregate supply and aggregate demand but don't cause LRAS to shift.
Things to remember:
The long-run aggregate supply curve shifts rightward as potential output increases.
Question
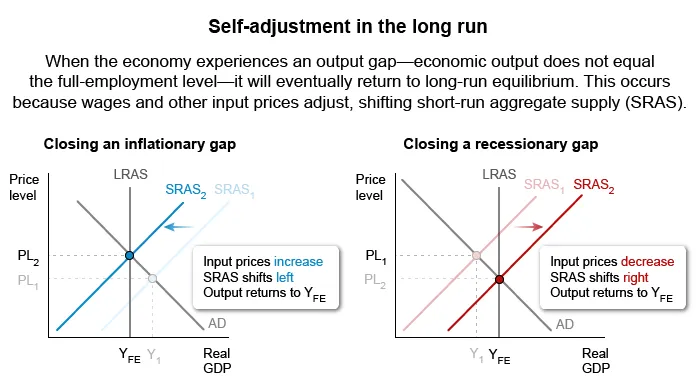
If an economy temporarily experiences increased energy costs, what happens to its short-run aggregate supply curve (SRAS) and its long-run aggregate supply curve (LRAS) during this time?
| A. The LRAS curve shifts leftward, and the SRAS curve stays the same | |
| B. The LRAS curve shifts rightward, and the SRAS curve shifts leftward | |
| C. The LRAS curve stays the same, and the SRAS curve shifts leftward | |
| D. Both curves shift rightward | |
| E. Both curves shift leftward |
Explanation:
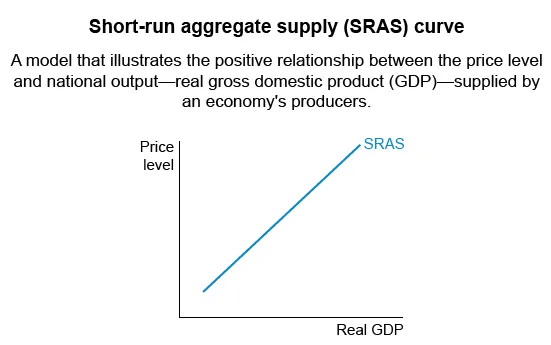
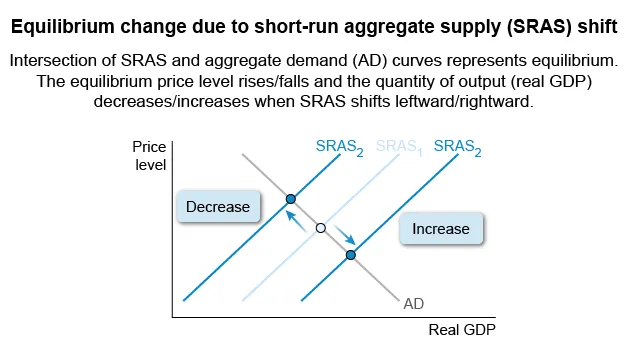
The short-run aggregate supply curve (SRAS) illustrates the quantities of output an economy's producers will supply at all price levels. When costs of inputs, such as energy, increase, profits decline and producers respond by decreasing short-run output at every price level.
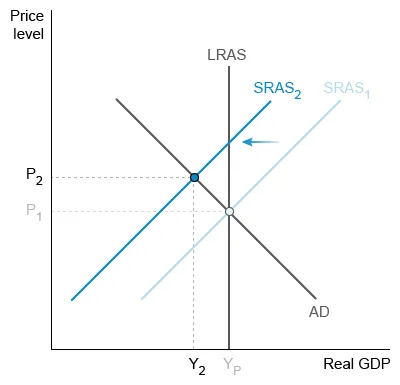
An increase in energy costs shifts SRAS leftward (SRAS1 to SRAS2); because SRAS doesn't shift rightward or stay the same, eliminate Choices A and D.
Higher energy costs result in less output (Y2), as well as cost-push inflation, as the price level increases from P1 to P2. However, if energy costs rise only temporarily and later fall, SRAS will shift back rightward, intersecting aggregate demand (AD) on the long-run aggregate supply curve (LRAS).
LRAS is potential output (YP), so it shifts only when an economy's resources change. For example, if energy costs rise and don't return to their previous levels, the increased opportunity cost of using energy limits production; as a result, YP will fall as LRAS shifts leftward.
Because energy costs rise temporarily and then later fall, LRAS doesn't shift rightward or leftward, so eliminate Choices B and E.
Things to remember:
A temporary increase in input costs shifts the short-run aggregate supply curve (SRAS) leftward, causing cost-push inflation, but does not shift the long-run aggregate supply curve (LRAS).
AP Macroeconomics Practice Test: Financial Sector
Question
Which of the following will cause an increase in the quantity of money demanded?
| A. Decreasing nominal interest rates | |
| B. Decreasing prices in the economy | |
| C. Decreasing real national output | |
| D. Increasing real interest rates | |
| E. Increasing unemployment |
Explanation:
The money demand curve (MD) illustrates the tradeoff faced when choosing which assets to own. Money is liquid, meaning consumers can easily use money for transactions. But inflation erodes buying power, so savers prefer to hold their wealth in assets that pay more interest. However, assets with higher interest rates are less liquid, and thus less convenient, than money.
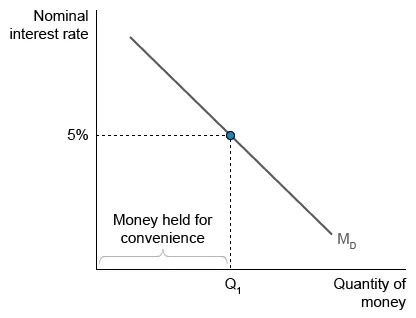
The interest rate is the opportunity cost of holding money. For example, if the interest rate is 5%, the quantity of money demanded—the amount held for convenience—is Q1. Money exceeding Q1 will not be held but instead used to purchase more interest-earning assets.
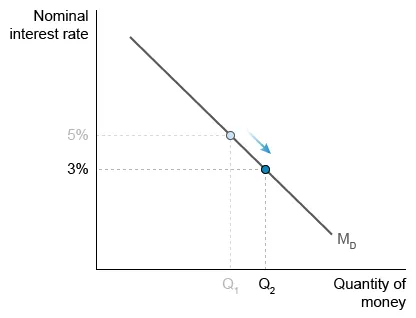
However, when the nominal interest rate falls, the opportunity cost of holding money falls, and the quantity of money demanded increases (Q1 to Q2).
(Choices B, C, and E) When MD shifts leftward, the quantity of money demanded at every nominal interest rate decreases, not increases. MD shifts leftward when:
- prices fall and people need less money to make purchases.
- output falls, unemployment rises, and people make fewer purchases because their incomes decrease.
(Choice D) The real interest rate rises when nominal interest rates increase or inflation decreases, both of which will cause the quantity of money demanded to decrease, not increase.
Things to remember:
There is an inverse relationship between the nominal interest rate and the quantity of money people want to hold.
Question
In a limited-reserves banking system, which of the following is true about a contractionary monetary policy?
| A. It increases the supply of reserves | |
| B. It increases the money multiplier | |
| C. It decreases the quantity of money demanded | |
| D. It decreases the federal funds rate | |
| E. It decreases the equilibrium nominal interest rate |
Explanation:
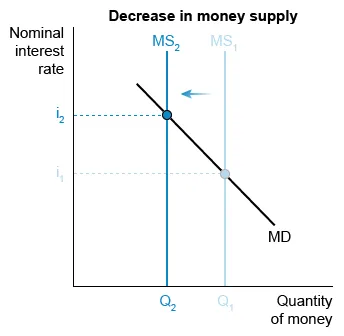
In a limited-reserves banking system, the central bank implements contractionary monetary policy through actions that decrease the money supply (MS).
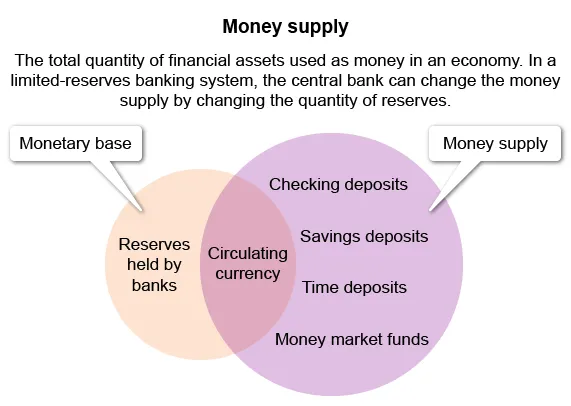
Following the leftward shift from MS1 to MS2, MS intersects the money demand (MD) curve at a higher nominal interest rate in the money market.
When the nominal interest rate increases, the opportunity cost of holding money rather than investing it in interest-earning assets increases, so less money is demanded. The MD curve's negative slope on the graph above illustrates the inverse relationship between the nominal interest rate and the quantity of money demanded.
Contractionary monetary policy thus raises interest rates and decreases the quantity of money demanded.
| The federal funds rate the US interbank lending rate is the policy rate by which the Federal Reserve influences most other interest rates. |
(Choices A, D, and E) Contractionary monetary policy decreases, rather than increases, reserves, causing the federal funds rate and the equilibrium nominal interest rate to increase, not decrease.
(Choice B) Contractionary monetary policies, such as increasing the required reserve ratio, decrease, rather than increase, the money multiplier because they discourage bank lending.
Things to remember:
The money demand curve shows that people demand a lower quantity of money when the nominal interest rate increases.
Question
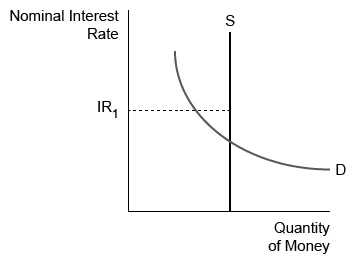
Assume IR1 represents the current nominal interest rate in the money market. It can be concluded that
| A. there is currently a shortage of money | |
| B. money demand will increase to achieve equilibrium | |
| C. investors will buy short-term assets with interest rates below IR1 | |
| D. the quantity of money demanded equals the quantity of money supplied | |
| E. those holding money will expect the inflation rate to be less than IR1 |
Explanation:
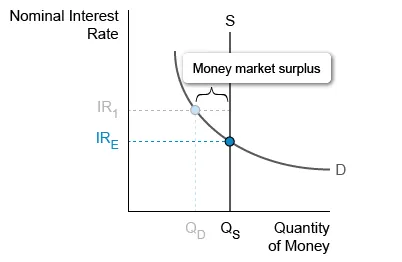
When the nominal interest rate (IR1) is above the equilibrium rate (IRE), the quantity of money supplied (QS) exceeds the quantity demanded (QD), creating a money market surplus. The opportunity cost for people holding this surplus of money is the interest they could earn by investing in short-term interest-bearing assets such as bonds.
As people holding money buy assets, sellers lower their nominal interest rates while still attracting buyers. Investors seeking gains from interest continue purchasing assets even when the nominal interest rate decreases below IR1.
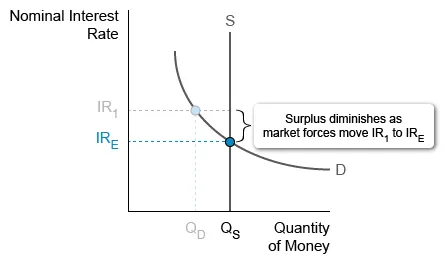
However, as the interest rate decreases, assets become less attractive to investors—the opportunity cost of holding money falls as people increasingly prefer spending over investing. The quantity of money demanded increases as people forego investing, and the money market moves toward equilibrium at IRE, diminishing the surplus.
(Choices A and D) At IR1, the quantity of money supplied exceeds the quantity demanded, representing a surplus, not a shortage.
(Choice B) Money demand will not increase unless a determinant of money demand, such as the price level, changes.
(Choice E) There isn't enough information to determine the inflationary expectations of people holding money.
Things to remember:
Market forces eliminate a money surplus because a decreasing nominal interest rate reduces the opportunity cost of holding money.
AP Macroeconomics Practice Test: Long-Run Consequences of Stabilization Policies
Question
A supply-side fiscal policy action to increase economic growth would be to increase which of the following?
| A. Government funding for research and development | |
| B. Government purchases of domestically produced goods and services | |
| C. Government payments to unemployed workers | |
| D. Tax rates on business profits | |
| E. Regulations on energy production |
Explanation:
Economic growth occurs when an economy's real output per capita increases over time. The aggregate demand–aggregate supply model shows growth as a rightward shift of long-run aggregate supply (LRAS). LRAS corresponds to an economy's full-employment level of output, or potential output (YF).
A government aiming to increase LRAS can fund research and development projects to create new technologies, such as faster computers that boost productivity. A government promotes economic growth by increasing the economy's technological capabilities.
(Choices B and C) Government purchases of domestic output and payments to unemployed workers increase aggregate demand in the short run. However, long-run adjustment means economic growth does not necessarily result from those actions.
Actions disincentivizing production by reducing firms' profits—discouraging economic growth—include:
- (Choice D) increasing taxes on business profits.
- (Choice E) increasing energy regulations, likely increasing firms' costs.
Things to remember:
Government policies that encourage the development of new technologies increase potential output, creating economic growth.
Question
A government budget surplus occurs when
| A. income tax rates decrease | |
| B. consumption plus investment exceeds government spending | |
| C. changes in government borrowing result in crowding out | |
| D. government spending plus transfer payments are less than tax revenues | |
| E. a government has fully satisfied its debt obligations |
Explanation:
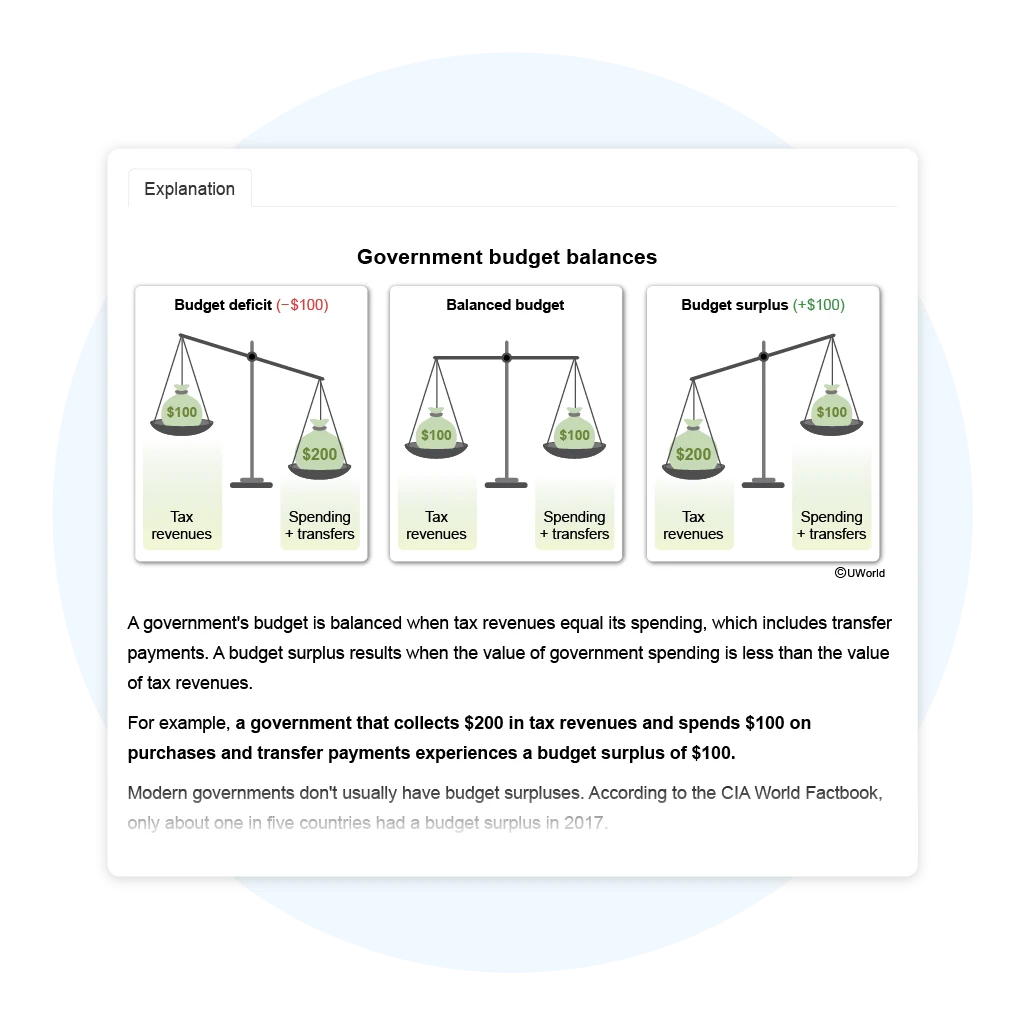
A government's budget is balanced when tax revenues equal its spending, which includes transfer payments. A budget surplus results when the value of government spending is less than the value of tax revenues.
For example, a government that collects $200 in tax revenues and spends $100 on purchases and transfer payments experiences a budget surplus of $100.
|
|
Modern governments don't usually have budget surpluses. According to the CIA World Factbook, only about one in five countries had a budget surplus in 2017. |
(Choice A) A government's budget balance can't be determined without knowing the value of its spending.
(Choice B) The relative values of government spending and tax revenues, not consumption plus investment, determine a budget surplus.
(Choice C) Crowding out results from increased government borrowing, which is unlikely when a government has a budget surplus.
(Choice E) National debt accumulates on an ongoing basis, but government budgets apply to only the current fiscal year. Therefore, a government can have a current budget surplus despite having outstanding debts.
Things to remember:
A budget surplus results when government spending, including transfer payments, is less than tax revenues.
Question
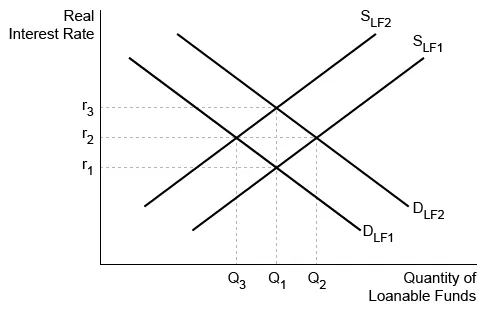
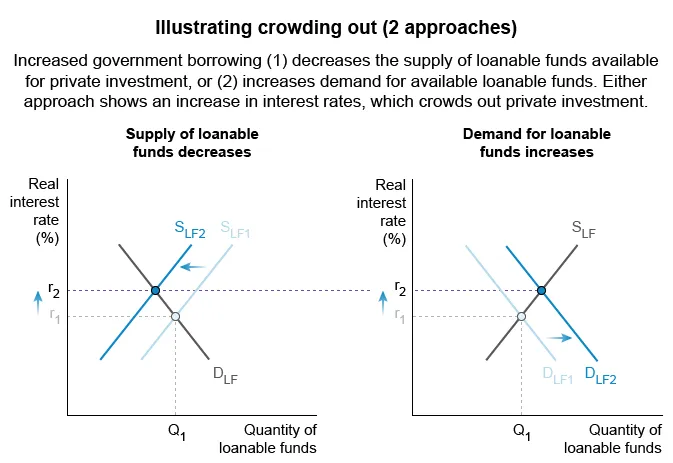
Based on the graph of the loanable funds market above, crowding out occurs when government borrowing causes a change from
| A. SLF2 to SLF1 | |
| B. DLF1 to DLF2 | |
| C. DLF2 to DLF1 | |
| D. Q1 to Q3 | |
| E. Q2 to Q1 |
Hint:
Crowding out occurs when interest rates increase.
Explanation:
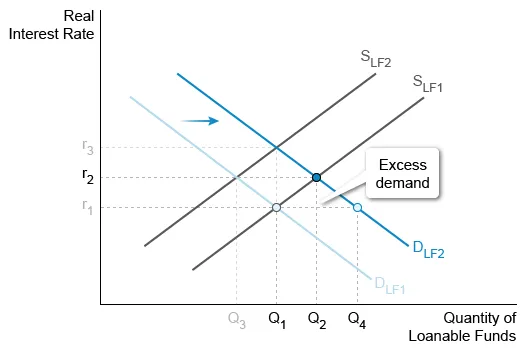
To fulfill its financial obligations when running a budget deficit, a government must borrow—shifting demand (DLF1 to DLF2)—in the loanable funds market. This shift creates excess demand (Q4 − Q1) at the initial real interest rate, r1, causing the equilibrium interest rate to rise (r1 to r2).
As the interest rate rises, the quantity of loanable funds borrowed for private investment decreases. This short-run effect is called crowding out. Thus, increased government borrowing increases the demand for loanable funds, causing interest rates to rise and crowding out to occur.
Crowding out does not result from a decrease in interest rates, which can be illustrated by:
- (Choice A) a rightward shift of the supply curve for loanable funds (SLF2 to SLF1).
- (Choice C) a leftward shift of DLF (DLF2 to DLF1).
(Choices D and E) Crowding out refers to the effect of increased interest rates on private investment, not the total quantity of loanable funds supplied and demanded.
Things to remember:
Increased government borrowing increases the interest rate and crowds out private investment in the short run.
AP Macroeconomics Practice Test: Open Economy- International Trade and Finance
Question
If Norway's central bank increases its administered rates, which of the following will most likely occur?
| A. Norway's capital inflow will decrease | |
| B. Norway's export revenue will decrease | |
| C. Norway's private investment in plant and equipment will increase | |
| D. Norway's domestic consumption will increase | |
| E. Norway's budget will move toward a surplus |
Explanation:
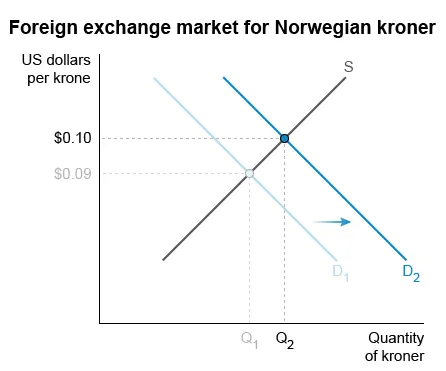
An increase in Norway's central bank's administered rates increases the interest rate on Norwegian interest-bearing assets. Foreign investors then purchase more Norwegian assets, raising demand (D1 to D2) for the Norwegian krone—which then appreciates—in the foreign exchange market.
The appreciation of the krone increases Norwegian export prices in terms of foreign currencies, resulting in foreign buyers purchasing fewer Norwegian goods and services. Therefore, Norwegian export revenue decreases. When Norway's central bank raises its administered rates, Norway's exports become more expensive and export revenue decreases.
|
|
When the krone appreciates, the price of Norwegian exports increases in other countries. Norwegian exporters' revenue decreases because the quantity sold decreases, but the revenue received per unit—in kroner—does not change. |
An increase in administered rates by Norway's central bank is a contractionary monetary policy. Raising administered rates will increase domestic interest rates, and as a result:
- (Choice A) foreign investors will buy more kroner to purchase Norwegian interest-bearing assets, which will increase, not decrease, Norway's capital inflow.
- (Choices C and D) the cost of borrowing will increase, which will decrease Norwegians' private investment in plant and equipment and domestic consumption.
(Choice E) Raising administered rates will decrease aggregate demand and output. All else equal, tax revenue will fall, moving Norway's budget toward deficit, not surplus.
Things to remember:
Raising interest rates causes a currency to appreciate, increasing the cost of exports for foreign buyers. As a result, export revenue will fall, and net exports will decrease.
Question
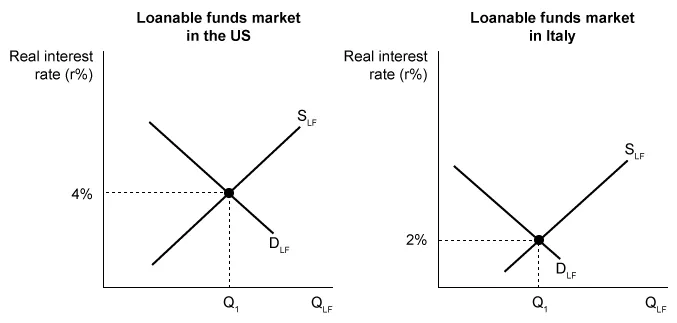
Using the graphs above, which of the following correctly identifies what will happen to financial capital flows between the United States and Italy?
| A. Financial capital will flow out of the United States and into Italy. | |
| B. Financial capital will flow into both the United States and Italy. | |
| C. Financial capital will flow out of Italy and into the United States. | |
| D. Financial capital flows will not change. |
Explanation:
Financial capital flows toward the country with the higher real interest rate. People who have money saved in Italy will take their money out of Italy and put it into the US to earn a higher return on their investment (savings). Therefore, financial capital will flow out of Italy and into the US.


UWorlds multiple choice questions are similar to the ones on the official AP exam and allowed me to time myself for each question. This was very helpful for me as I was able to answer questions faster and could finish the questions on the actual exam. The explanations for each question went in-depth and gave important details pertaining to events in the timeline. Through this, I was able to gain important skills for the exam and get a 5.
See MoreBefore, I had a hard time studying and staying focused because it was just boring, but now with UWorld, not only can I focus, but I actually feel motivated to learn!
The explanations were clear and I could practice the question based on units. I got a 5 in the end!! So, I think it’s very helpful and I’ll be using it to study for my future exams 🙂 You guys provide so many different functions to help students like me, and I really appreciate it, it’s really worth the money.
See More