AP® Macroeconomics Formula and Graph Sheet

AP® Macroeconomics covers key concepts such as inflation, GDP, and monetary policy. The formula and graph sheet is an excellent tool to help you memorize essential formulas and graphs for your exam.
An image showing Demand and supply schedule

Mastering the AP Macroeconomics Formula Sheet

The AP Macroeconomics formula sheet is your ultimate study companion for acing the exam. It’s packed with essential formulas and graphs that simplify economic concepts. Whether you’re studying inflation, GDP, or monetary policy, this sheet helps you easily remember and apply what you’ve learned. Having it by your side during exam season will reduce stress and improve focus, giving you the confidence to master the exam.

Need help with AP Macroeconomics?
Study smarter with visual learning.
Visual explanation of budget deficit and budget surplus

Key AP Macro Formulas & Equations

Unit 1: Basic Economic Concepts

Per Unit Opportunity Cost

When given output values:

Per unit opportunity cost = Opportunity cost Units gained

When given input values:

per unit opportunity cost = Time taken to make 1 unit of good Time needed to make 1 unit of other good
Measures the value of the next best alternative when making a decision.

Unit 2: Economic Indicators & the Business Cycle

Gross Domestic Product (Expenditure approach)
GDP = C + I + G + Xn
The expenditure approach to calculating GDP adds the categories of consumption, private investment, government spending, and net exports (exports - imports)
Nominal GDP
Nominal GDP = Real GDP × GDP deflator (in hundredths)
The total market value of all final goods and services produced within a country, calculated using current prices.
Real GDP
Real GDP = Nominal GDP GDP deflator (in hundredths)
The nominal GDP adjusted for changes in the price level to reflect the true value of goods and services produced.
GDP Deflator
GDP Deflator = Nominal GDP Real GDP × 100
A measure of the overall changes in the price level of an economy.
Unemployment Rate
UR = #Unemployed # in Labor Force × 100%
Indicates the percentage of the labor force that is unemployed and actively seeking employment.
Labor Force Participation Rate (LFPR)
LFPR = LF Eligible Population × 100%
Shows the proportion of the eligible population that is either employed or actively seeking work.
Consumer Price Index (CPI)
CPIt = Cost of basket in year t Cost of basket base year × 100
Measures the average change in the prices consumers pay for a market basket of goods and services.
Inflation Rate (using CPI)
Inflation rate = CPInew - CPIold CPIold × 100
Indicates the pace at which the overall price level increases from one period to another.
Inflation rate (using GDP deflator)
Inflation rate (%) = (New GDP deflator - Previous GDP deflator) Previous GDP deflator × 100
Indicates the pace at which the overall output increases from one period to another.

Unit 3: National Income and Price Determination

Marginal Propensity to Consume (MPC)
MPC = change in spending change in income
Represents the fraction of additional income spent on consumption.
Marginal Propensity to Save (MPS)
MPS = ΔS ΔY
Indicates the change in savings for every unit change in disposable income.
Expenditure Multiplier
Expenditure multiplier = 1 1 - MPC
Determines the total impact on GDP from an initial change in consumption. Can be positive for increases in spending and negative for decreases.
Tax Multiplier
Tax multiplier = - MPC MPS
Measures the change in GDP resulting from a change in taxes. Can be negative for increases in taxes and positive for decreases in taxes.
Having trouble keeping up with AP Macroeconomics?
Let us show you the secrets to AP success.
Visual illustration of the consumer price index for a market basket of goods over time.

Unit 4: Financial Sector

Nominal Interest Rate
Nominal interest rate = real interest rate + expected inflation
The interest rate you earn (or pay) on a loan that you see on a sign advertising interest rates.
Real Interest Rate
Real interest rate = nominal interest rate - inflation rate
The effective interest rate earned (or paid) on a loan that is adjusted to the nominal interest rate for inflation.
Inflation Rate
inflation rate = nominal interest rate - real interest rate
Money Multiplier
MM = 1 rr
Estimates the maximum amount of money the banking system can generate from each dollar of reserves.
Actual Money Multiplier
Money multiplier = money supply monetary base
Estimates the maximum amount of money the banking system can generate from each dollar or reserves. The ratio of the money supply to the monetary base.

Unit 5: Long-Run Consequences of Stabilization Policies

Equation of Exchange
M × V = P × Y
The quantity theory of money supposes that the price level is proportional to the money supply.
Per Capita GDP
GDP per capita = GDP population
Measures the average economic output per person, indicating the standard of living.

Unit 6: Open Economy—International Trade and Finance

Balance of Payments
CA + CFA = 0
The sum of the current and capital and financial accounts must equal zero.
Exchange Rate
Exchange rateA = # of units of currency B units of currency A
Expressed as the units of one currency required to buy a single unit of the other currency.

Key AP Macroeconomics Graphs

Production Possibilities Curve (PPC) - Unit 1
The Production Possibilities Curve (PPC) graph represents the highest quantity of 2 goods that can be produced with a given set of resources and technology.
Demand and Supply- Unit 1
The graph of the supply and demand for a good/service in a competitive market. No one individual buyer or seller can influence the price of the good/service.
Business Cycle - Unit 2
A business cycle is the repeating pattern of economic growth and decline, consisting of 4 phases: expansion, peak, contraction, and trough.
Circular Flow Model - Unit 2
The circular flow model illustrates how money, goods, and services move through an economy, also called the circular flow of income model.
AD-AS Graph - Unit 3
The AD-AS model shows how aggregate demand and supply interact to determine an economy's equilibrium price and output levels, helping to analyze macroeconomic changes like growth, recessions, and inflation.
Money Graph - Unit 4
The money market shows the relationship between the supply of money (set by the central bank) and the demand for money, setting the nominal interest rate.
Reserve Market - Unit 4
The reserve market illustrates the relationship between the policy rate and the quantity of money banks want to hold in reserves.
Loanable Funds - Unit 4
The loanable funds market illustrates the quantity of money people want to save in an economy (supply) and the quantity of money people want to borrow (demand). This market sets the real interest rate.
Phillips Curve - Unit 5
The Phillips Curve is a graph that illustrates the connection between unemployment and inflation.
Aggregate Production Function - Unit 5
The aggregate production function illustrates the level of output that can be produced based on the amount of resources available.
Foreign Exchange Market - Unit 6
The foreign exchange market illustrates the relationship between the supply of a currency and the demand for a currency. This market sets the exchange rate of the currency relative to another currency.

Memorizing and Applying AP Macroeconomics Formulas

Whether tackling multiple-choice or free-response questions, using the correct formula is essential for solving problems accurately and efficiently. By understanding when and how to apply these ap macro formulas, you’ll be ready to answer complex macroeconomic questions and maximize your score. Let’s explore some expert-recommended tips and strategies to help you master the formulas and excel in the exam.

Write down all the key formulas on a cheat sheet and practice them regularly. The more familiar you are with them, the faster you’ll recall them during the exam.
Breaking down each formula into its units and variables can help you understand what each represents and save time when identifying the necessary information.
Time yourself while practicing. It will help you quickly identify the formula to use and apply it under exam conditions.
The first step toward solving a question is to read it carefully and think about what it asks you to do.
The next step is to look for the keywords in the question that hint at the formula. This helps narrow down and recognize the appropriate formula to be used.
This tried-and-tested elimination technique for MCQs holds true for this exam. Eliminate options that don’t fit the formula's context, thereby reducing the choices.
For free-response questions, explaining each step can earn points, even if you know the answer. Labeling each part of the equation and using appropriate units can increase your points.
If the formula involves a graph (like the AD/AS model), sketch the graph to visually understand what’s happening in the economy. This helps you apply the correct formula based on the shifts in the graph.
Want better grades in AP Macroeconomics?
Make UWorld your study partner
Graph indicating the impact of back-to-school sales on demand for goods

Frequently Asked Questions (FAQs)

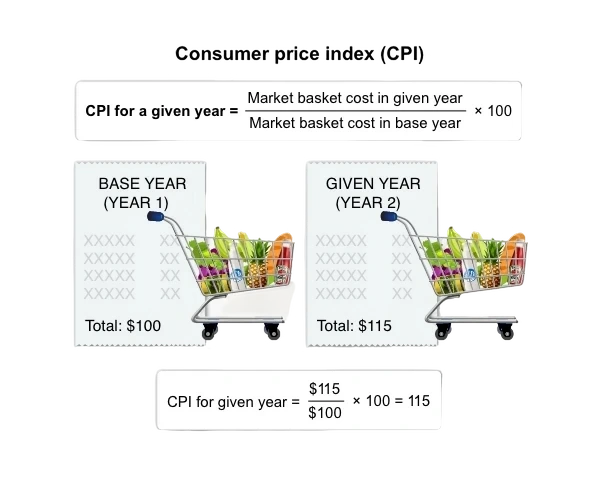
Yes, AP Macroeconomics involves basic math, such as percentages, graphs, and calculations for concepts such as GDP and inflation.

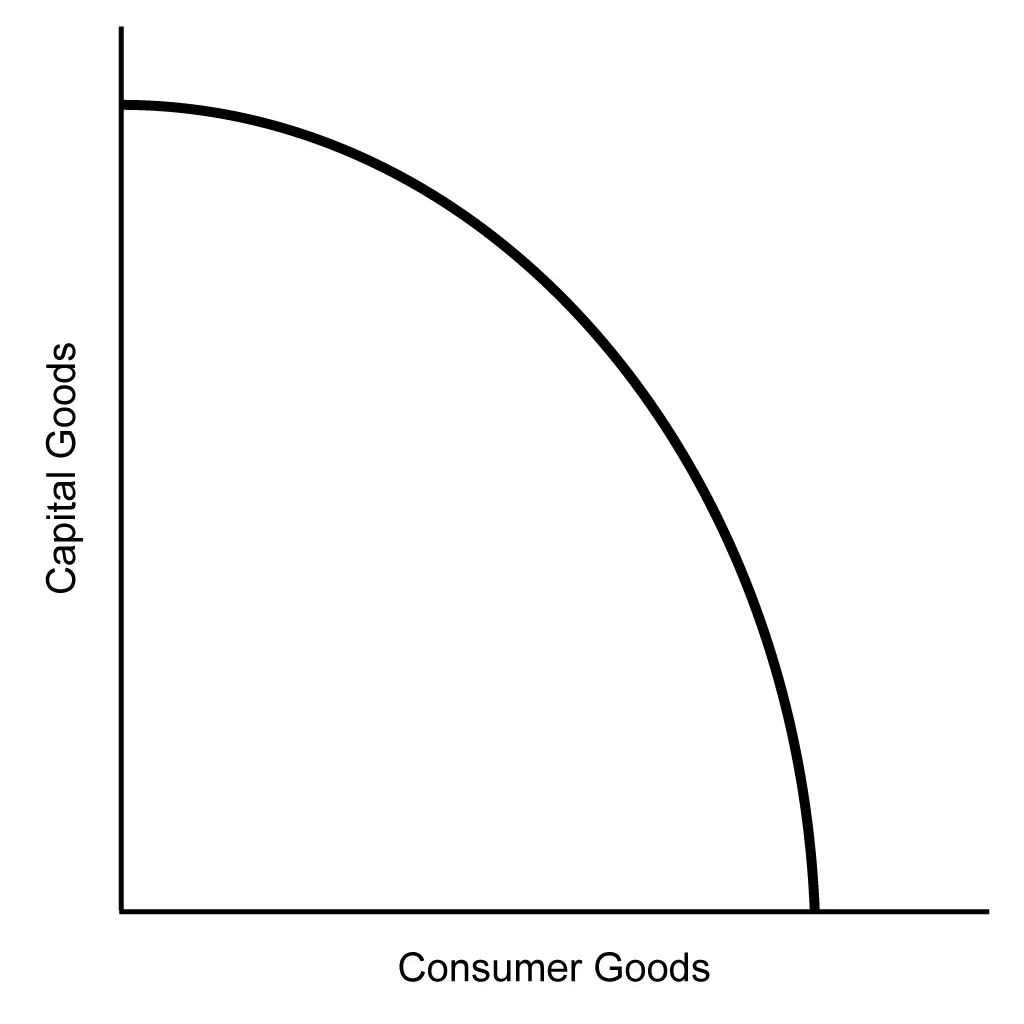
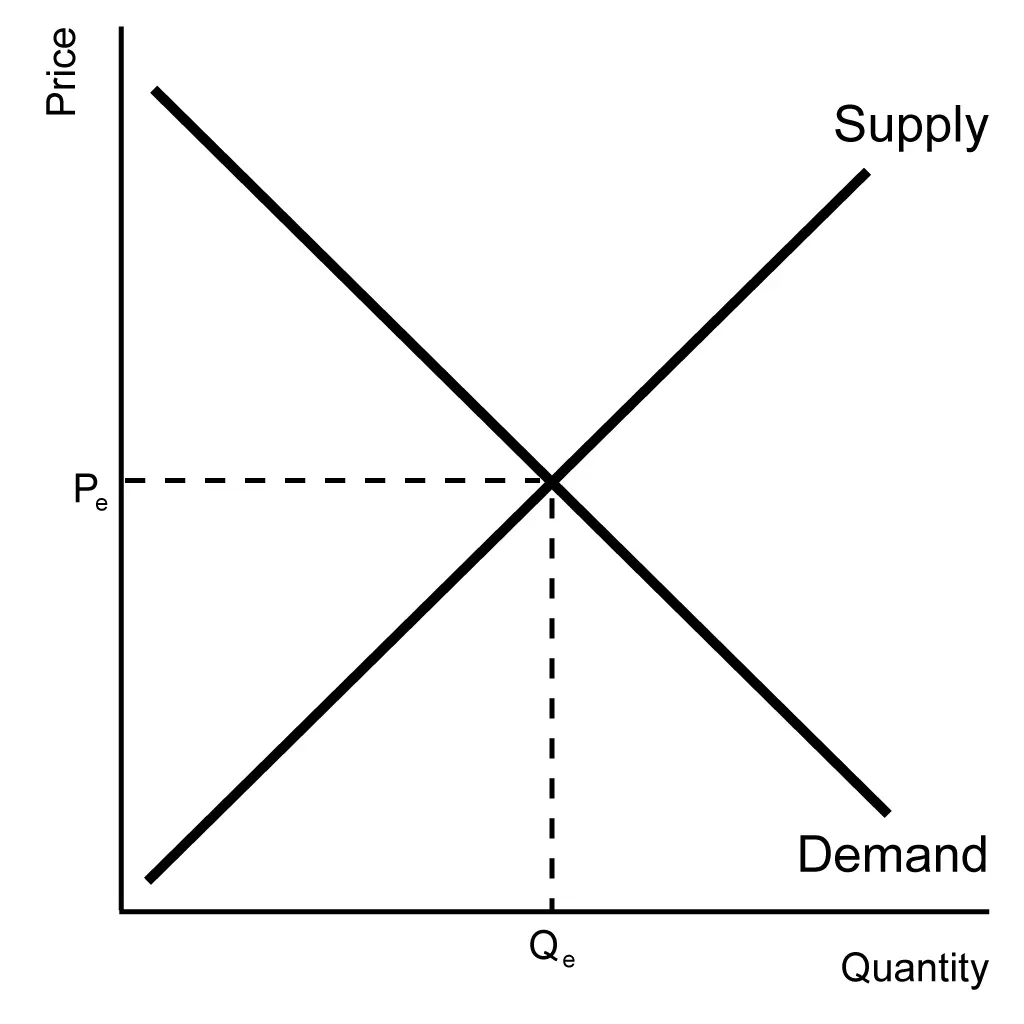
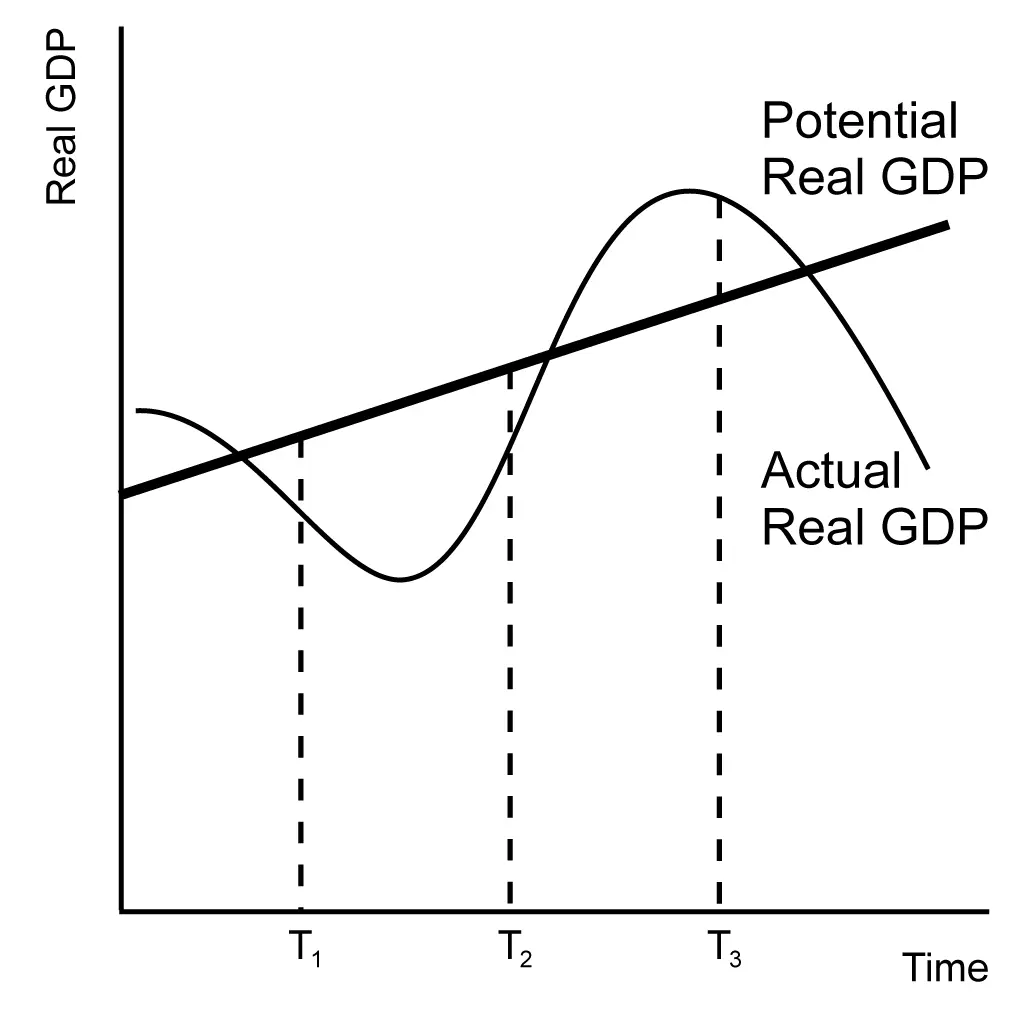
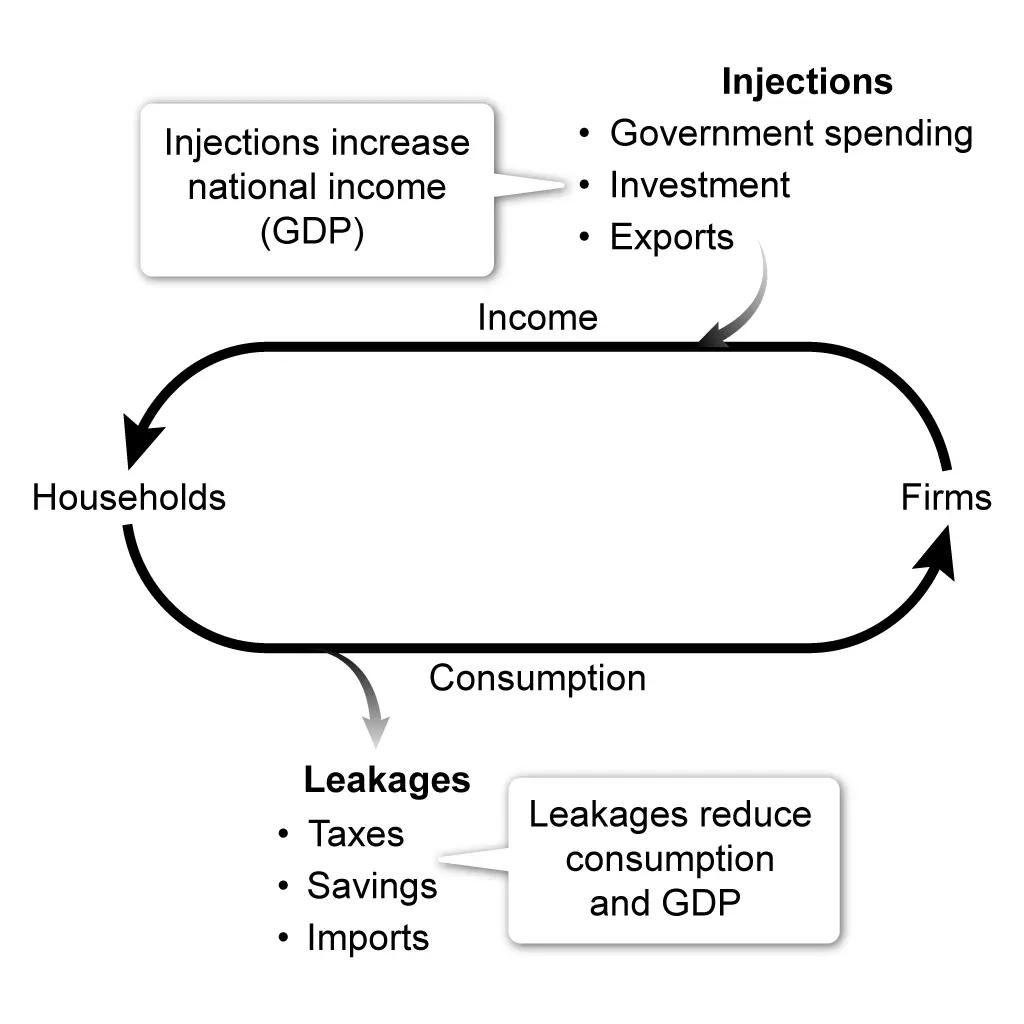
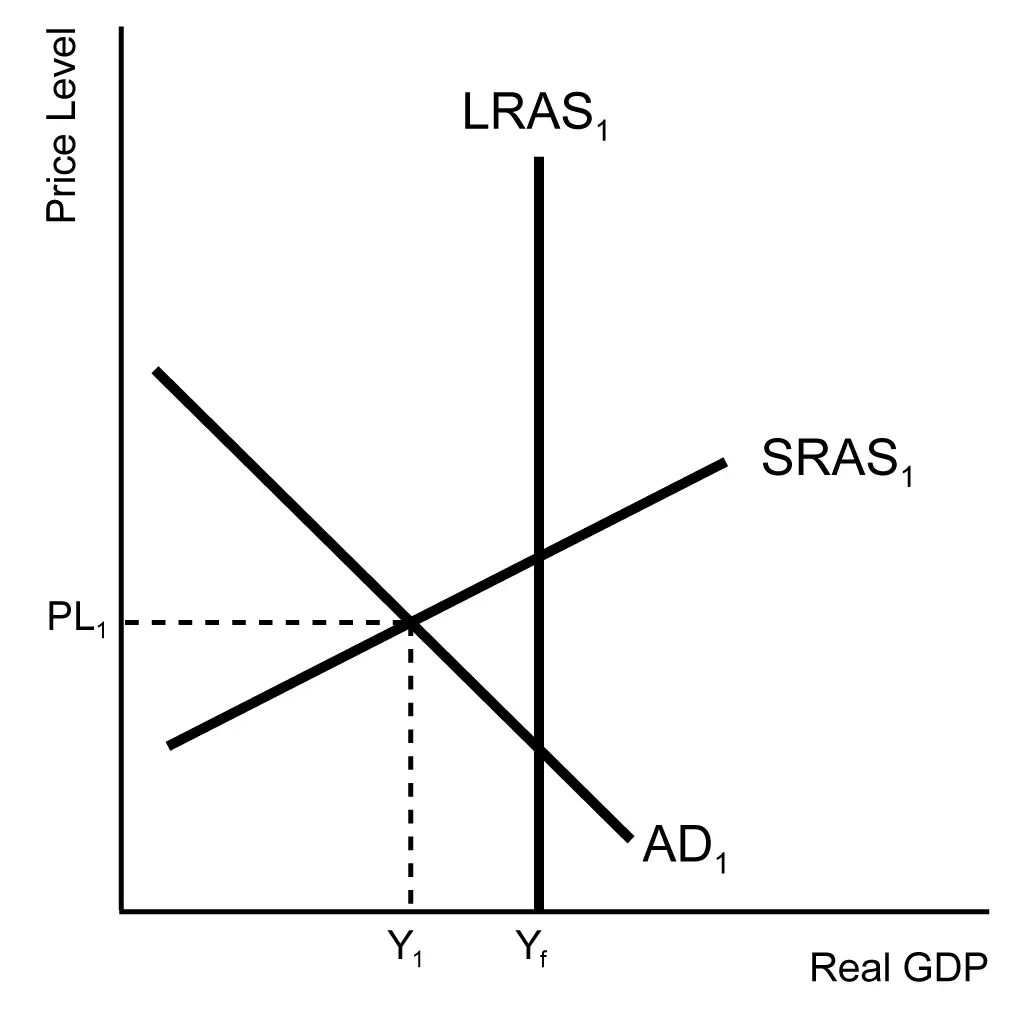
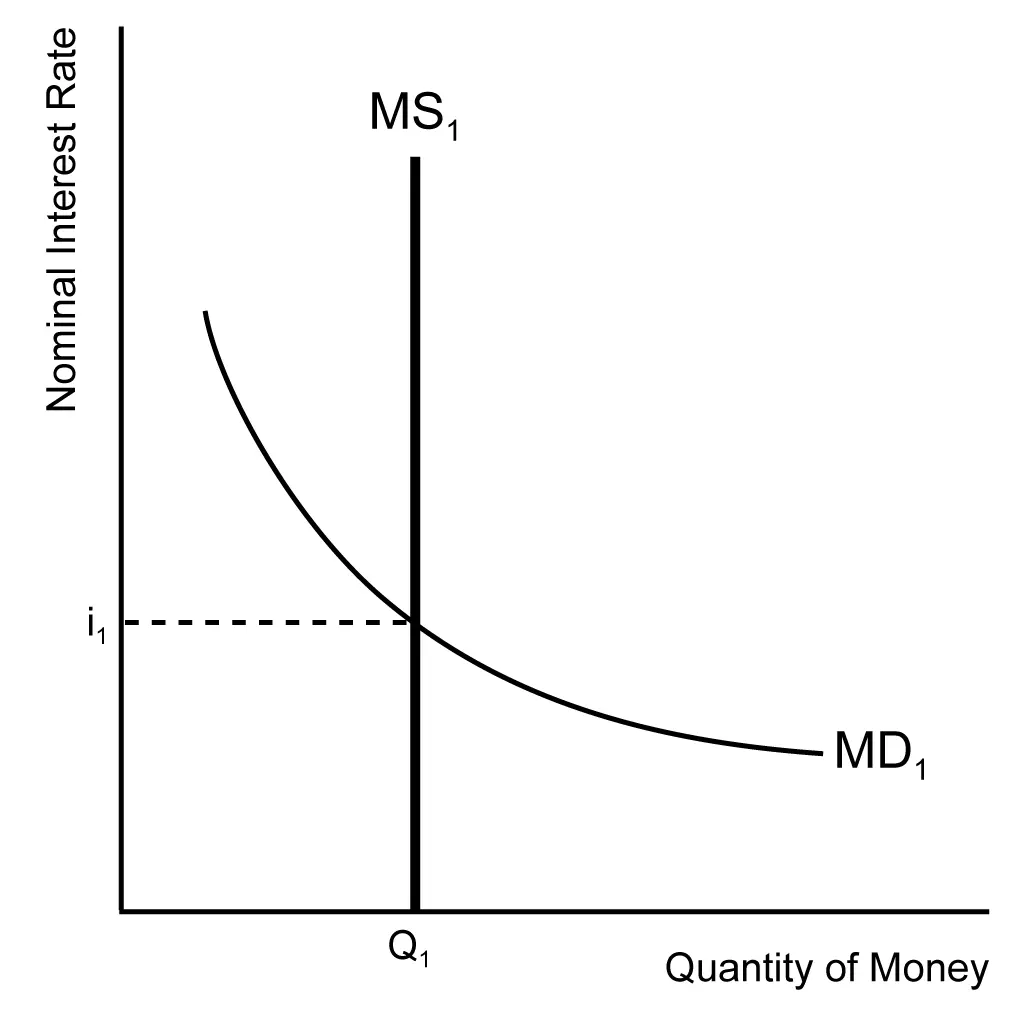
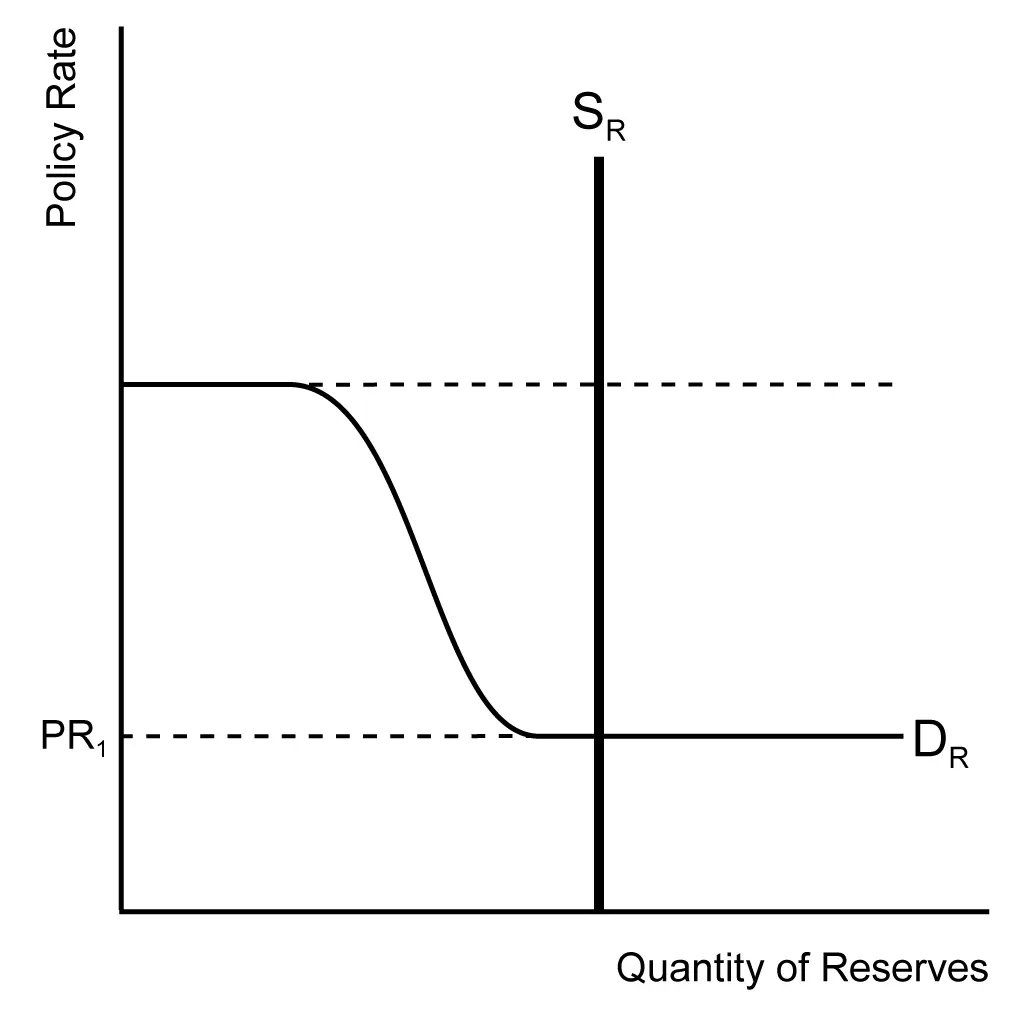
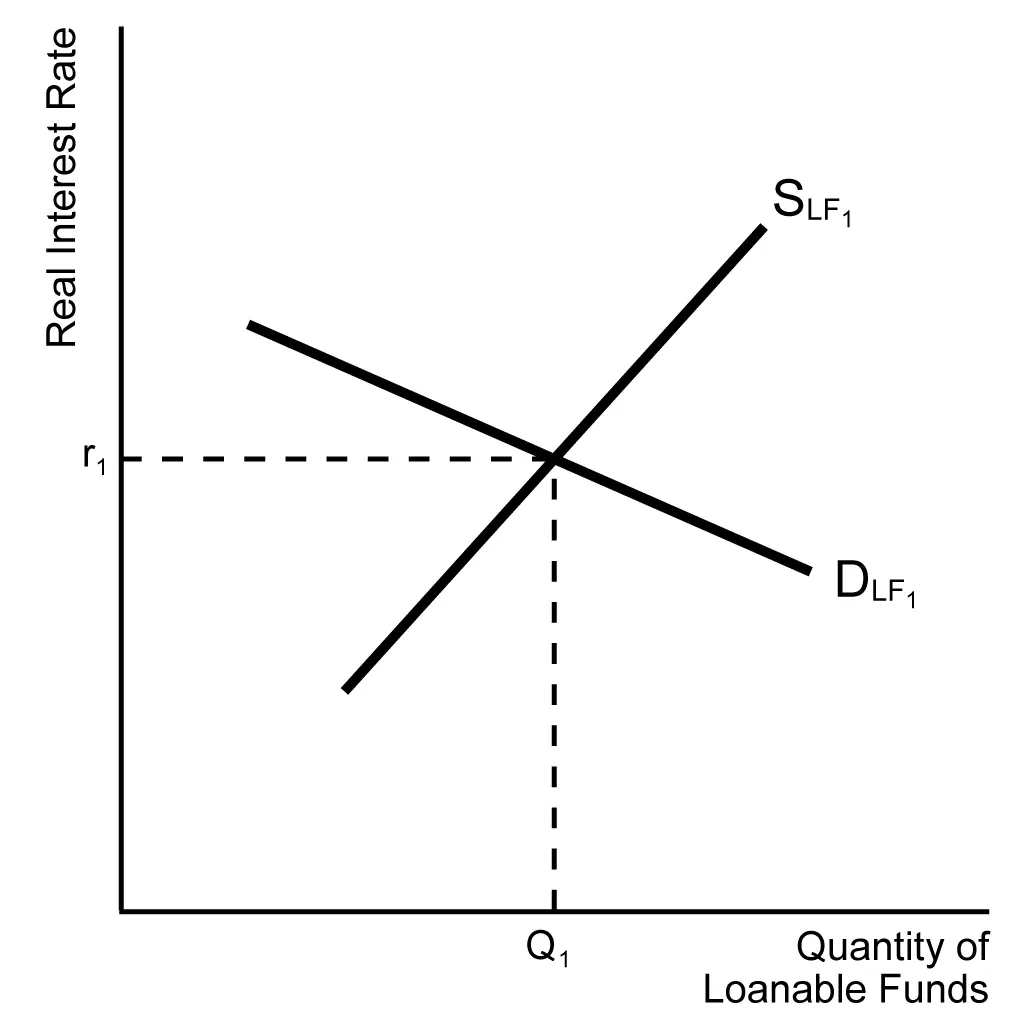
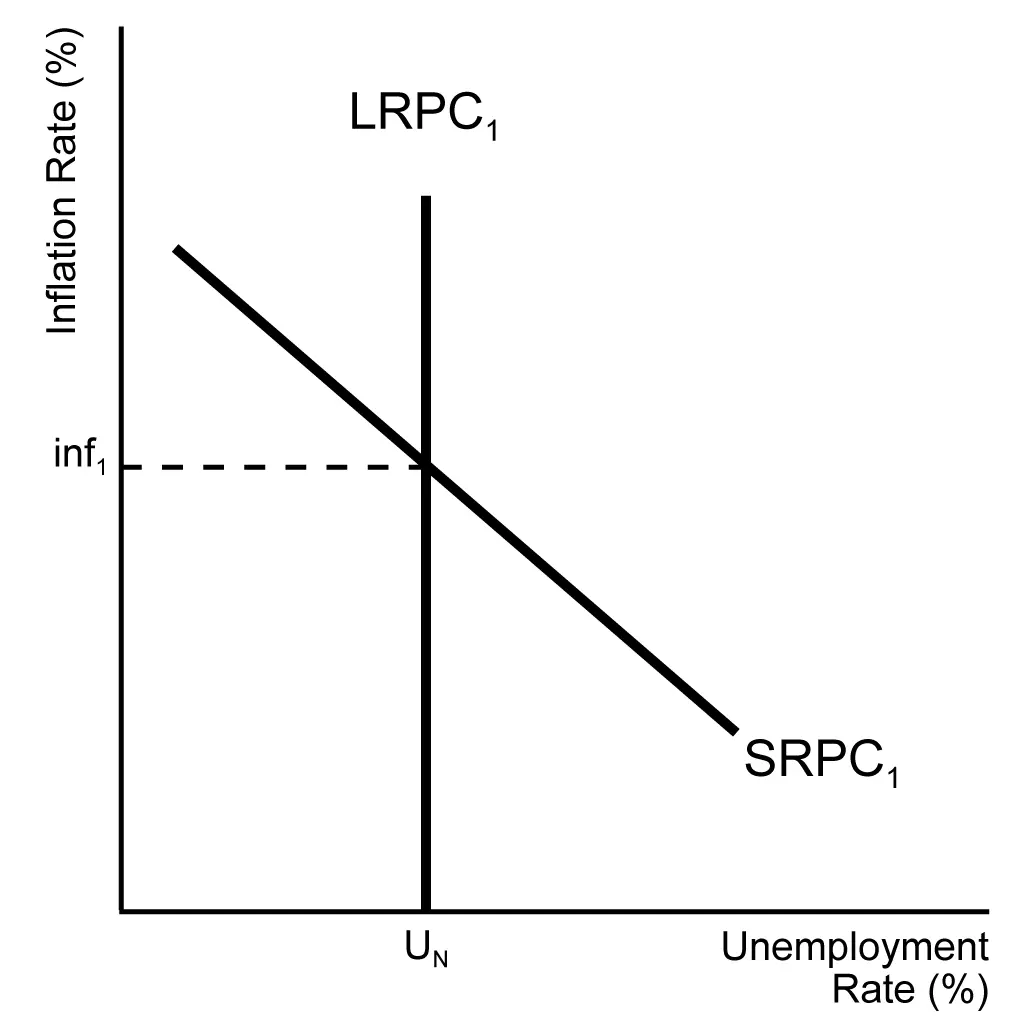
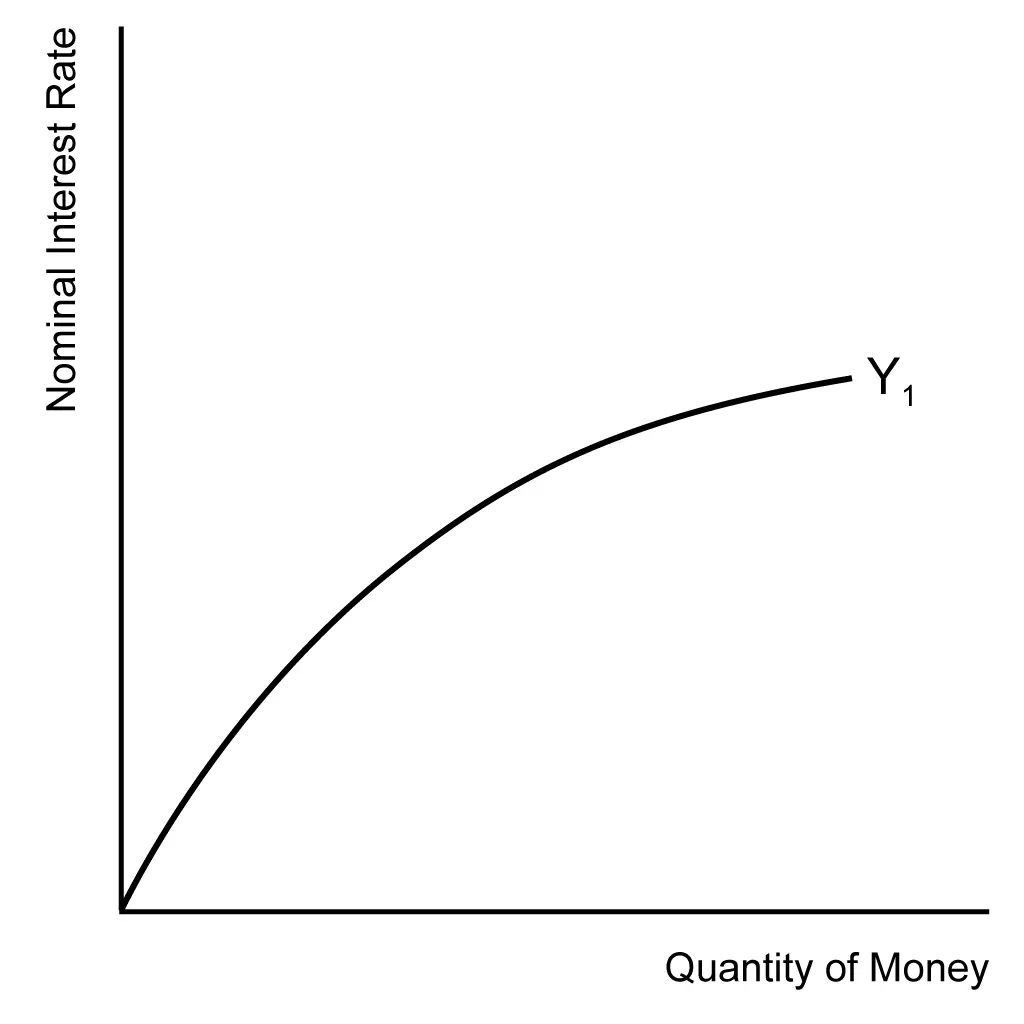
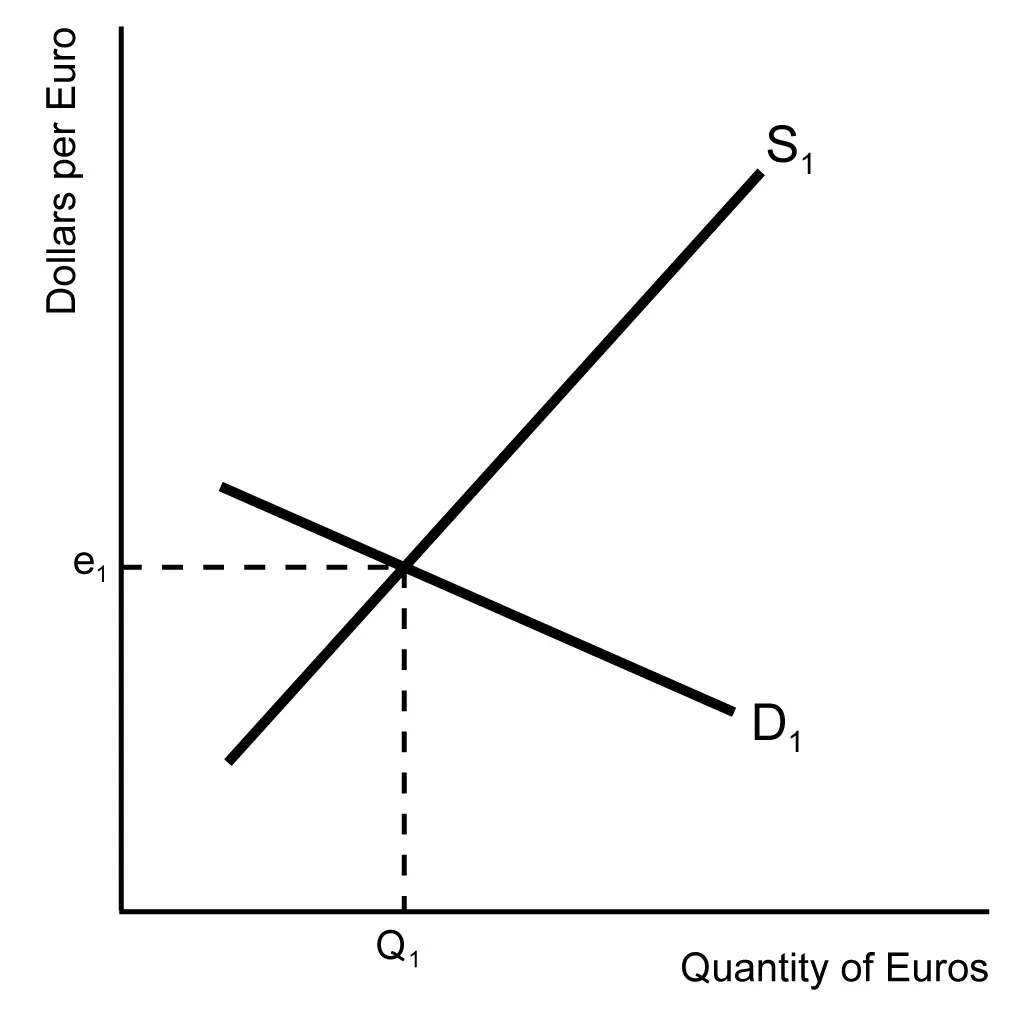
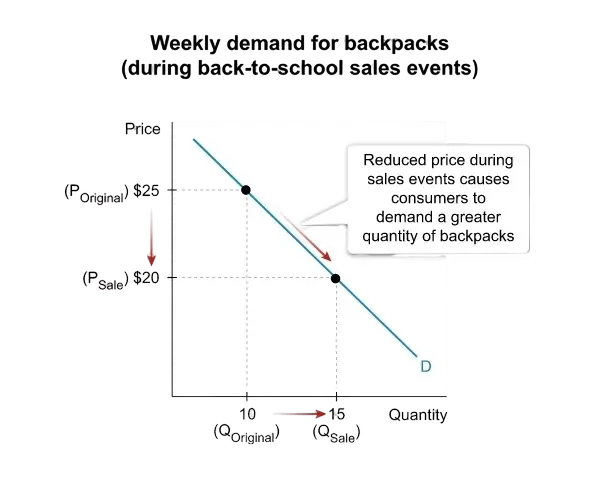
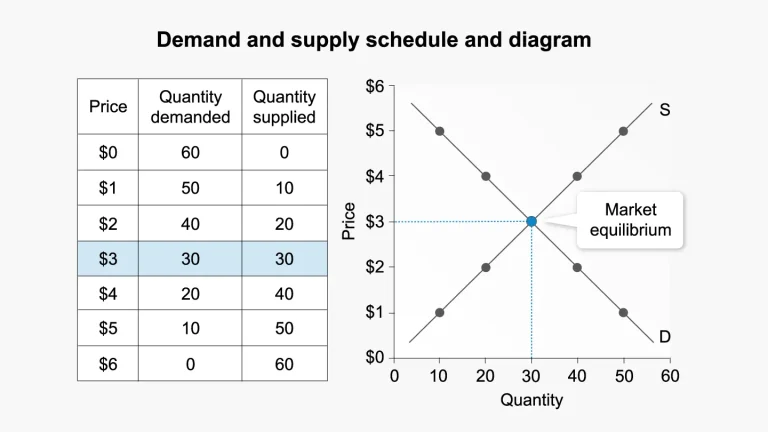
Graphs can help you visualize and understand key macroeconomic concepts like supply, demand, and economic equilibrium.

You can avoid common mistakes with AP Macro formulas by understanding the formula units for each component and double-checking the calculations.

UWorld provides a comprehensive list of practice questions to help you master AP Macroeconomics formulas.

The most commonly tested AP Macro formulas are GDP, unemployment rate, inflation rate, and money multiplier.

Yes, fully grasping the concepts can help you apply formulas and solve problems without relying on rote memorization.

References

View More...
Scroll to Top