Passage
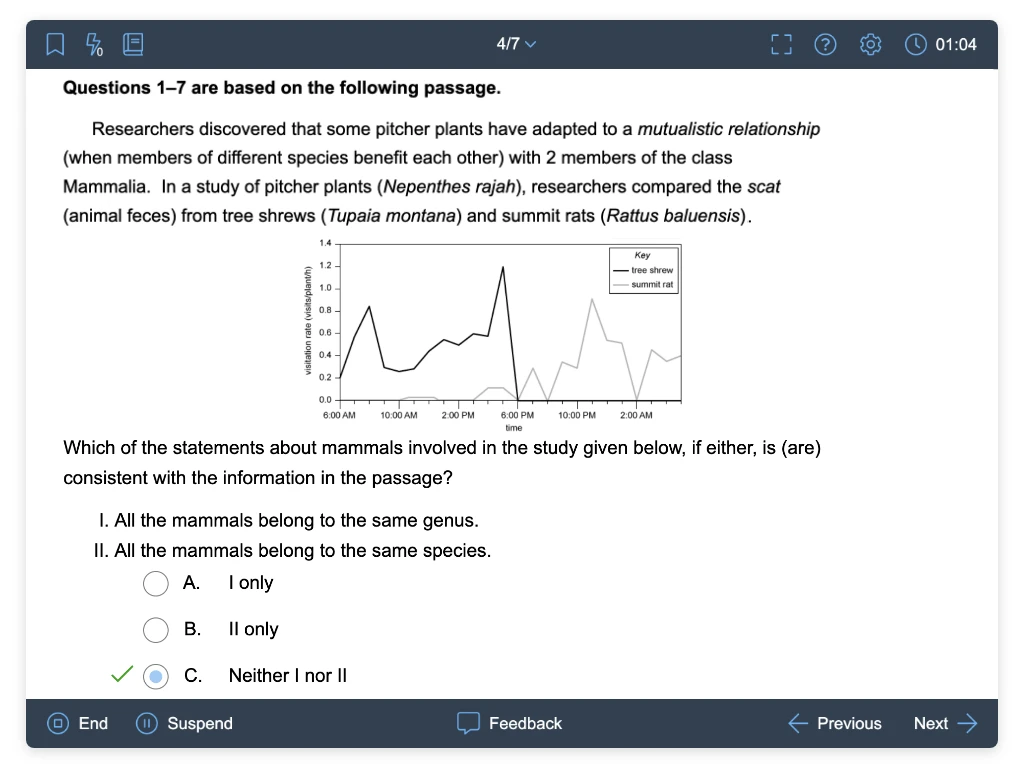
Phthalates are chemicals that are added to plastics to make them soft and flexible. Because phthalates are not chemically bound to the plastics to which they are added, they can be released into the environment. Two experiments examined how the shape and concentration of iron oxide (Fe2O3) nanoparticles affect the degradation (chemical breakdown) of environmental dibutyl phthalate (DBP) upon exposure to light and hydrogen peroxide (H2O2).
Experiment 1
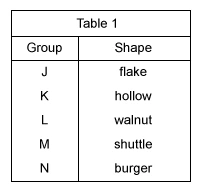
Each of 15 identical beakers received 100 mL of a DBP solution with a concentration of 13 mg/L. The beakers were equally divided into 5 groups (Groups J–N). For each group of beakers, Fe2O3 nanoparticles with 1 of 5 different shapes were added to achieve a nanoparticle concentration of 0.30 mg/mL (see Table 1).
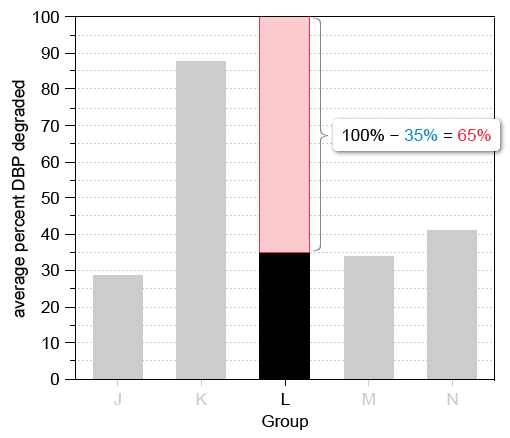
Each beaker then received 50 microliters (µL) of H2O2 and was placed on a magnetic stirrer located 20 cm from a 250 W light source. After 60 min, the concentration of DBP in each beaker was measured, and the average percent DBP degraded in each group was calculated (see Figure 1).
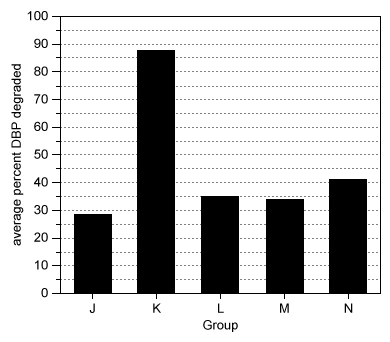
Figure 1
Experiment 2
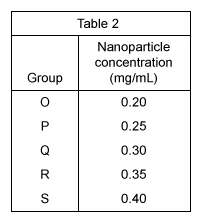
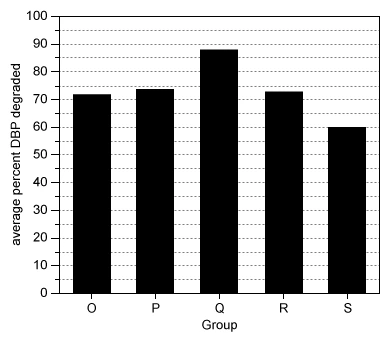
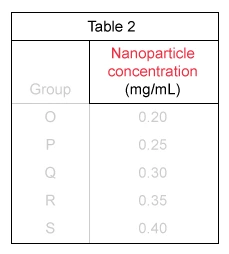
Each of 15 identical beakers received 100 mL of a DBP solution with a concentration of 13 mg/L. The beakers were then equally divided into 5 groups (Groups O–S). Each beaker received 50 µL of H2O2 and was placed on a magnetic stirrer located 20 cm from a 250 W light source. For each group of beakers, hollow-shaped Fe2O3 nanoparticles were then added at 1 of 5 different nanoparticle concentrations (see Table 2).
After 60 min, the average percent DBP degraded in each group was determined as in Experiment 1 (see Figure 2).
Question
Consider the units of measurement "µL" and "mg/mL" in Experiment 2. Which of the following phrases best describes the quantities represented by these units?
| µL | mg/mL | |
| A. mass of H2O2 | duration of nanoparticle exposure | |
| B. mass of H2O2 | nanoparticle concentration | |
| C. volume of H2O2 | duration of nanoparticle exposure | |
| D. volume of H2O2 | nanoparticle concentration |
Explanation
Experiment 2: Each beaker received 50 µL of H2O2…. For each group of beakers, hollow shaped Fe2O3 nanoparticles were then added at 1 of 5 different nanoparticle concentrations (see Table 2).
Read the passage and analyze the results of Experiment 2, shown in Table 2, to determine which choice best describes the quantities represented by "µL" and "mg/mL."
According to the passage, 50 µL of H2O2 was added to each beaker in Experiment 2.
|
|
Prior Knowledge: Units that involve liters, including microliters (millionth of a liter) typically are a measure of volume. |
Table 2 shows that the unit for nanoparticle concentration in Experiment 2 is "mg/mL."
Therefore, the phrase that best describes the quantity represented by "µL" is the volume of H2O2, and the phrase that best describes the quantity represented by "mg/mL" is the nanoparticle concentration.
(Choices A and B) "µL" is a unit of volume, not mass.
(Choice C) Although "µL" is the unit representing the volume of H2O2, the unit "mg/mL" represents the concentration of the nanoparticles, not the duration of exposure to the nanoparticles.
Things to remember:
The quantities represented by particular units can be determined by using information given in the passage about the quantities and by obtaining information from the figures.
Passage
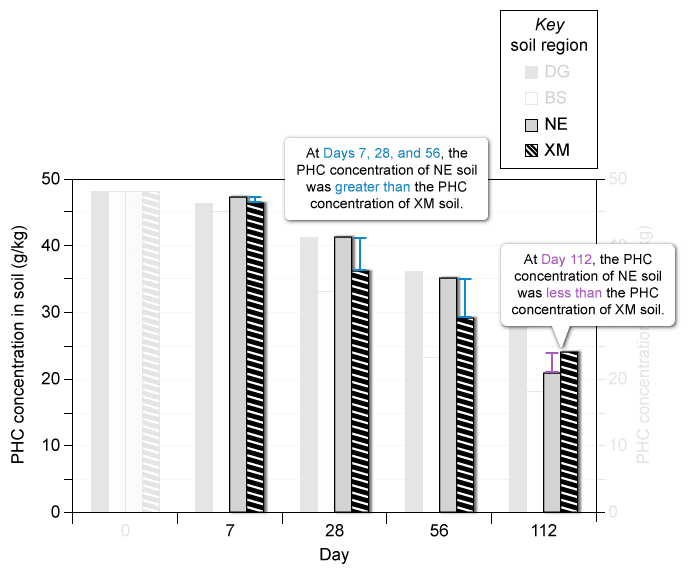
A study was done to examine the rate at which petroleum hydrocarbons (PHC) from crude oil are degraded by microorganisms in soil from 4 geographical regions: Dagang (DG), Bohai Sea (BS), Northeast China (NE), and Xiamen (XM). First, for each region 25 g of crude oil was mixed with 500 g of soil in a plastic container. The containers were then incubated in the dark at 22°C for 112 days. Figure 1 shows how the PHC concentration, in g/kg, in each soil sample changed over time. Table 1 shows the pH and the percent by mass of clay, silt, and sand, respectively, of each of the 4 soils, prior to the addition of the crude oil.
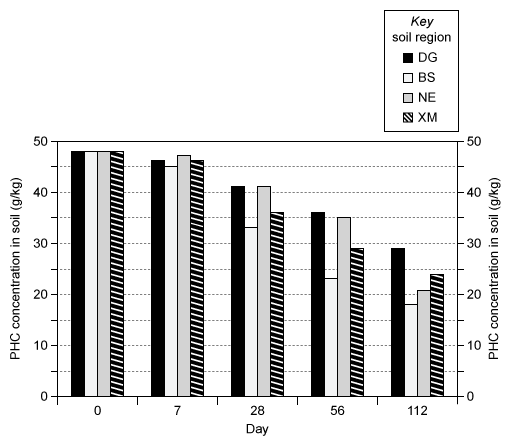
Figure 1
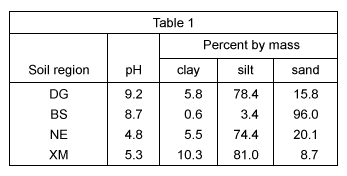
Table 1
Question
Which of the following statements comparing the PHC concentration in NE soil with the PHC concentration in XM soil is supported by the results in Figure 1?
| A. For all the days after Day 0, the PHC concentration in NE soil was greater than the PHC concentration in XM soil. | |
| B. For all the days after Day 0, the PHC concentration in NE soil was less than the PHC concentration in XM soil. | |
| C. For all the days after Day 0, the PHC concentration in NE soil was the same as the PHC concentration in XM soil. | |
| D. For some of the days after Day 0, the PHC concentration in NE soil was greater than the PHC concentration in XM soil; on the other day, the PHC concentration in NE soil was less than the PHC concentration in XM soil. |
Explanation
Examine Figure 1 to determine which statement comparing the PHC concentration in NE soil with the PHC concentration in XM soil is supported by the data.
The height of each bar represents the PHC concentration in soil. Figure 1 shows:
-
At Days 7, 28, and 56, the bars representing PHC concentrations in NE soil are taller than the bars representing PHC concentrations in XM soil.
-
At Day 112, the bar representing PHC concentration in NE soil is shorter than the bar representing PHC concentration in XM soil.
Based on this information, the statement "For some of the days after Day 0, the PHC concentration in NE soil was greater than the PHC concentration in XM soil; on the other day, the PHC concentration in NE soil was less than the PHC concentration in XM soil" is supported by the results in Figure 1.
(Choices A and B) The PHC concentration in NE soil was not consistently greater than or less than the PHC concentration in XM soil.
(Choice C) The PHC concentration in NE soil was not the same as the PHC concentration in XM soil for any of the days after Day 0.
Things to remember:
A statement that is supported by the results in a particular figure will accurately describe the results shown in the figure.
Passage
Phthalates are chemicals that are added to plastics to make them soft and flexible. Because phthalates are not chemically bound to the plastics to which they are added, they can be released into the environment. Two experiments examined how the shape and concentration of iron oxide (Fe2O3) nanoparticles affect the degradation (chemical breakdown) of environmental dibutyl phthalate (DBP) upon exposure to light and hydrogen peroxide (H2O2).
Experiment 1
Each of 15 identical beakers received 100 mL of a DBP solution with a concentration of 13 mg/L. The beakers were equally divided into 5 groups (Groups J–N). For each group of beakers, Fe2O3 nanoparticles with 1 of 5 different shapes were added to achieve a nanoparticle concentration of 0.30 mg/mL (see Table 1).
Each beaker then received 50 microliters (µL) of H2O2 and was placed on a magnetic stirrer located 20 cm from a 250 W light source. After 60 min, the concentration of DBP in each beaker was measured, and the average percent DBP degraded in each group was calculated (see Figure 1).
Figure 1
Experiment 2
Each of 15 identical beakers received 100 mL of a DBP solution with a concentration of 13 mg/L. The beakers were then equally divided into 5 groups (Groups O–S). Each beaker received 50 µL of H2O2 and was placed on a magnetic stirrer located 20 cm from a 250 W light source. For each group of beakers, hollow-shaped Fe2O3 nanoparticles were then added at 1 of 5 different nanoparticle concentrations (see Table 2).
After 60 min, the average percent DBP degraded in each group was determined as in Experiment 1 (see Figure 2).
Question
Based on Figure 1, in Group L, what percent of the DBP was NOT chemically broken down after 60 min?
| A. 35% | |
| B. 45% | |
| C. 55% | |
| D. 65% |
Explanation
P1: Two experiments examined how the shape and concentration of iron oxide (Fe2O3) nanoparticles affect the degradation (chemical breakdown) of environmental dibutyl phthalate.
Analyze the passage and Figure 1 to determine the percent of DBP that was NOT chemically broken down after 60 min in Group L.
According to the passage, the degradation of DBP is the chemical breakdown. Thus, the percent DBP degraded is what remains of the initial amount of DBP (100%).
Figure 1 shows that the average percent DBP degraded in Group L was approximately 35%.
Therefore, the percent of the DBP in Group L that was NOT chemically broken down after 60 min was 100% − 35% = 65%.
(Choice A) 35% is the percent of the DBP that was chemically broken down, but the question asks for the percent that was not broken down.
(Choices B and C) 45% and 55% are less than the amount that is not chemically broken down.
Things to remember:
When asked to determine what percent of an event has NOT occurred, subtract the proportion of the event that has occurred from the total.

I got a 35 from studying using UWorld, it has the best question bank along with the most informative explanations.”
A useful feature is the timed mode - I was able to stay within the time constraints for the ACT, especially in the science section. Overall, I would recommend UWorld for anyone who is looking to improve their ACT score; it will not disappoint.”
I think UWorld ACT is really well done and is quite accurate, especially with the math and science questions. I also used it for English and my score improved just this week! Thanks UWorld!