New! ACT QBank Now Available | Study smarter for the updated digital test.

ACT® Math Practice Tests and Questions

Try Our Sample ACT Math Questions
Our ACT® Math Practice Tests and Questions are expertly designed to match or surpass the difficulty level of the actual exam, ensuring a realistic practice experience. With comprehensive answer explanations and vivid illustrations, we make even the most challenging concepts easily understandable.

Free Sample ACT Math Questions

Our ACT Math practice questions are routinely updated to reflect the current ACT in both format and difficulty, so you know exactly what to expect on exam day. Plus, you’ll get in-depth explanations for each answer choice. Check it out for yourself…

Question

The Summer Olympic Games are among the most-watched internationally televised sporting events and have been held in over 20 different countries. The table below gives the number of U.S. viewers, in millions, for 8 Summer Olympics opening ceremonies located in different international cities.

Essentials

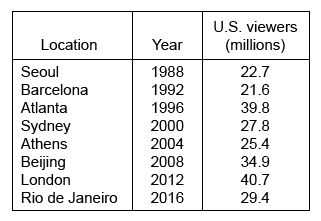
What is the median number of viewers, in millions, of these 8 Summer Olympics opening ceremonies?

A. 26.6
B. 27.8
C. 28.6
D. 30.2

Hint :

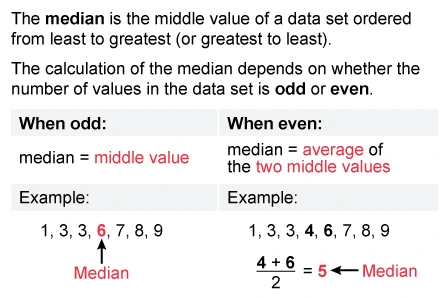
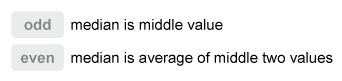
The median is the middle of a numerically ordered data set. When the number of values is odd, the median is the middle value. When it is even, the median is the average of the two middle values.

Explanation

The median of a data set with an even number of values is the average of the middle two values when all values are ordered numerically.

The given data set has 8 values, but the values are not in order. First order the number of U.S. viewers from least to greatest.

Essentials

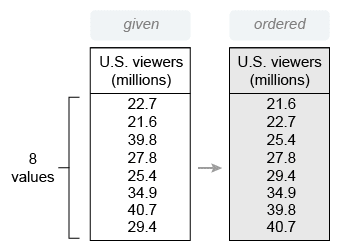
There are 8 values in the given table, so the median is the average of the 4th and 5th ordered numbers.

Essentials

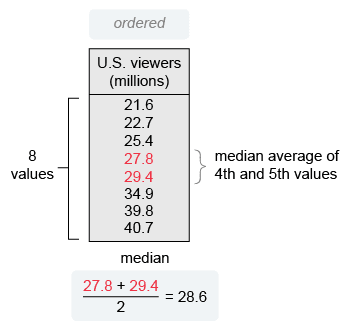
The median number of U.S. viewers of these 8 Summer Olympics opening ceremonies is 28.6 million.

(Choice A) 26.6 is the average of the middle two values of the unordered list of numbers of viewers. However, the median is the average of the middle two values when all values are ordered numerically.

(Choice B) 27.8 is the smallest of the middle two values of the ordered list of numbers of viewers. However, the median of a data set with an even number of values is the average of the middle two values.

(Choice D) 30.2 is the mean of the number of viewers. However, the question asks for the median of the number of viewers.

Things to remember:
The median is the middle value of a data set that is ordered numerically. When the number of values is odd, the median is the middle value. When it is even, the median is the average of the two middle values.

Essentials

Question

A box contains 12 flavored candies: 5 lime, 4 cherry, 1 orange, and 2 grape. Which of the following expressions gives the probability of choosing, at random and without replacement, a cherry candy for the first choice, a lime candy for the second choice, and a cherry candy for the third choice?

A.
( 412 ) . ( 512 ) . ( 312 )
B.
( 412 ) . ( 512 ) . ( 412 )
C.
( 412 ) . ( 511 ) . ( 310 )
D.
( 412 ) . ( 511 ) . ( 310 )

Hint :

The probability that dependent events occur is equal to the probability that the first event occurs multiplied by the probability that each consecutive event occurs, given that each preceding event has already occurred.

Explanation

The candies are chosen without replacement (they are not replaced in the box after being chosen), so each event of choosing a candy affects the probability of the events that follow. Therefore, the events are dependent.

The probability that dependent events occur is equal to the probability that the first event occurs multiplied by the probability that each consecutive event occurs, given that each preceding event has already occurred.

P ( 1st, 2nd, and 3rd event ) = P(1st) P(2nd) P(3rd)

The 1st event is that a cherry candy is chosen and not replaced in the box. The 2nd event is that a lime candy is chosen and not replaced, and the 3rd event is that a cherry candy is chosen and not replaced.

Therefore, the probability that a cherry candy is chosen first, a lime candy is chosen second, and a cherry candy is chosen third is:

P ( cherry 1st , lime 2nd , and cherry 3rd ) = P( cherry 1st ) P( lime 2nd ) P( cherry 3rd )

Use the following formula to find the probability P of each event:

P = number of desired outcomes total number of possible outcomes

P(cherry 1st)

The first event is that a cherry candy is chosen first from the box.

The number of desired outcomes for choosing cherry is the number of cherry candies in the box.
The total number of possible outcomes for choosing cherry is the total number of candies in the box.

P ( cherry 1st ) = cherry candies total candies in box

It is given that there are 4 cherry candies in the box, and it is given that the box contains a total of 12 candies. Therefore, the probability of choosing a cherry first is 4 12 .

P ( cherry 1st ) = 4 12

P(lime 2nd)

The probability that a lime candy is chosen second depends on the first event that a cherry candy is chosen, so it is the probability given that the first chosen candy is cherry.

The number of desired outcomes is the number of lime candies after a cherry candy is removed.
The number of possible outcomes is the number of candies remaining after a cherry candy is removed.

P ( lime 2nd ) = lime candies remaining candies in box

It is given that the full box had 5 lime candies. After a cherry candy is removed, there are still 5 lime candies and a total of 12 − 1 = 11 candies remaining.

Therefore, the probability of choosing a lime candy second is 5 11 .

P ( lime 2nd ) = 5 11

P(cherry 3rd)

The probability that a cherry candy is chosen third depends on the first event and the second event, so it is the probability given that the first chosen candy is cherry and the second chosen is lime.

The number of desired outcomes is the number of cherry candies remaining. The total number of possible outcomes is the number of candies remaining after a cherry and lime candy are removed.

P ( cherry 3rd ) = cherry candies remaining candies in box

It is given that the full box had 4 cherry candies. A cherry candy and then a lime candy were removed, so there are 4 − 1 = 3 cherry candies remaining and a total of 12 − 2 = 10 candies remaining.

Therefore, the probability of choosing a cherry candy third is 3 10 .

P ( cherry 3rd ) = 3 10

P(cherry 1st, lime 2nd, and cherry 3rd)

Now multiply the individual probabilities to find the probability that all three events occur.

P ( cherry 1st ) P ( lime 2nd ) P ( cherry 3rd )
Probability of cherry 1st, lime 2nd, and cherry 3rd
( 4 12 ) ( 5 11 ) ( 3 10 )
Plug in probabilities

The probability of choosing, at random and without replacement, a cherry candy first, a lime candy second, and a cherry candy third is ( 4 12 ) ( 5 11 ) ( 3 10 ) .

(Choice A) ( 4 12 ) ( 5 12 ) ( 3 12 ) may result from mistaking the total number of candies in the box to be 12 with each choice. However, the total number of candies in the box decreases by 1 each time a choice is made without replacement.

(Choice B) ( 4 12 ) ( 5 12 ) ( 4 12 ) is the probability of choosing a cherry candy, a lime candy, and a cherry candy with replacement instead of without replacement.

(Choice C) ( 4 12 ) ( 5 11 ) ( 4 10 ) may result from mistaking the number of cherry candies in the box for the third choice to be 4. However, the number of cherry candies in the box decreases by 1 each time a cherry candy is chosen without replacement.

Things to remember:

  • To find the probability of a single event, use the following formula:

P = number of desired outcomes total number of possible outcomes
  • Two events are dependent if one event affects the other.

  • To find the probability that two dependent events occur, multiply their individual probabilities together.

P ( 1st and 2nd event ) = P(1st) P(2nd)

Question

For all real values of x, which of the following is the solution set of 3x + 9 ≥ −12 ?

A. x ≤ −1
B. x ≥ −1
C. x ≤ −7
D. x ≥ −7

Hint :

To find the solution set of an inequality in one variable, isolate the variable by itself on one side of the inequality.

Explanation

The solution set of an inequality with one variable is the set of all values of the variable that make the inequality true. To find the solution set, solve for the variable in the inequality.

To solve for x in the given inequality 3x + 9 ≥ −12, subtract 9 from both sides and divide by 3 to isolate x so it is by itself on one side of the inequality.

3x + 9 ≥ −12
3x ≥ −21 Subtract 9 from both sides
x ≥ −7 Divide both sides by 3
Note: The inequality sign remains unchanged because 3 is positive.

Therefore, the solution set of the given inequality is x ≥ −7.

(Choice A) x ≤ −1 may result from a combination of the errors described in Choices B and C.

(Choice B) x ≥ −1 may result from incorrectly subtracting −12 − 9 to get −3 (instead of −21).

(Choice C) x ≤ −7 may result from mistakenly reversing the direction of the inequality. The inequality sign only reverses as a result of multiplying or dividing both sides by a negative number.

Things to remember:

  • To find the solution set of an inequality in one variable, isolate the variable by itself on one side of the inequality.
  • The solution set of an inequality is the set of all values that make the inequality true.

Question

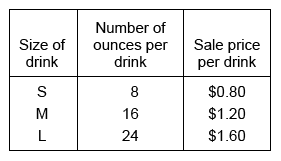
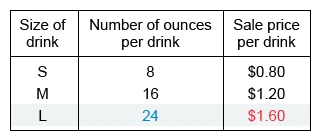
Bart's Burgers sells different sizes of drinks. The number of ounces and the sale price per drink for each of the 3 sizes are given in the table below. The sale price is the amount a customer pays for that drink.

Table

The average sale price per ounce of a large (L) drink is closest to which of the following amounts?

A. $0.07
B. $0.15
C. $0.20
D. $0.67

Hint :

Use the given table to identify the sale price and the number of ounces per large (L) drink.

Explanation

The average price per item is equal to the price of the items divided by the number of items.

average = total price of the items total number of items

The question asks for the average sale price per ounce of a large (L) drink.

The total price of the items is the price per L drink.
The total number of items is the ounces per L drink.

average sale price per ounce = price per L drink ounces per L drink

Identify from the given table that the price of an L drink is $1.60 and the number of ounces in an L drink is 24.

Plug these values into the formula above and divide to find the average sale price per ounce.

price per L drink ounces per L drink Average sale price per ounce
1.60 24 Plug in price and number of ounces
0.066... Divide
0.07 Round to match answer choices

The average sale price per ounce of a large (L) drink is $0.07.

(Choice B) $0.15 may result from mistakenly dividing the number of ounces in a large drink by an incorrect price, but the average sale price per ounce is price divided by ounces.

(Choice C) $0.20 may result from mistakenly dividing the price of a large drink by the number of ounces in a small drink (instead of in a large drink).

(Choice D) $0.67 may result from a calculation error when dividing $1.60 by 24 to get $0.66… (instead of $0.066…).

Things to remember:
The average price per item is equal to the price of the items divided by the number of items.

average = total price of the items total number of items

Question

An electronics company has an incentive program in which account representatives can earn money based on their monthly sales. Representatives can earn bonus pay based on their single highest sale for the month.

Table data

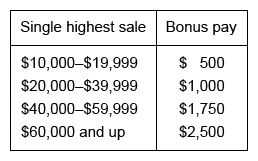
In a certain month, account representatives at the electronics company earned bonus pay that totaled $9,500. What is the maximum number of representatives whose single highest sale that month could have been in the range of $20,000–$39,999?

A. 4
B. 5
C. 9
D. 10

Hint :

The maximum number of representatives whose single highest sale could have been in the given range is equal to the greatest whole number of bonuses for that range that could have been paid with the given total bonus.

Explanation

The number of representatives is equivalent to the number of bonuses paid, so find the maximum number of bonuses that could have been paid with the given total.

Divide the given total bonus pay by the bonus for a single highest sale in the range of $20,000–$39,999 to determine the maximum number of bonuses.

maximun number of bonuses total bonus pay bonus for single sale

The given total bonus pay was $9,500.

To determine the bonus for a single highest sale in the range of $20,000–$39,999, use the given table.

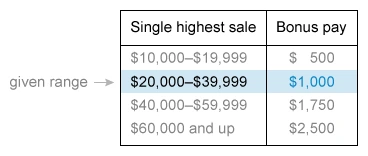
The bonus for a single highest sale in the given range is $1,000.

Divide the given total bonus pay (9,500) by the bonus for each sale (1,000) to determine the maximum number of bonuses that could have been paid.

total bonus pay bonus for single sale Maximum number of bonuses
9,500 1,000 Plug in values
9.5 Divide

The number of bonuses paid must be a whole number. The largest whole number less than 9.5 is 9, so the maximum number of bonuses that could be paid is 9.

Therefore, the maximum number of representatives is 9.

(Choices A and B) 4 and 5 may result from mistakenly dividing the highest value ($39,999) in the given range by the total bonus pay ($9,500).

(Choice D) 10 may result from mistakenly rounding 9.5 up to 10. However, the total bonus pay ($9,500) is not enough to pay a bonus of $1,000 to 10 representatives.

Get Exam-Ready with Exam-Like ACT Math Practice

Unlimited Exam-level Practice

Know exactly what to expect on exam day with questions that meet or exceed exam-level difficulty.

Customized to Your Needs

Set up custom tests to hone in on your weaknesses and turn them into strengths with our "Create Test" feature.

Understand the Why

Our team of experts writes detailed rationales for each answer choice so you can learn why you got an answer right or wrong.

Score Free ACT Questions Every Week!

Get ACT exam-ready with weekly exam-like questions sent to your inbox.

Get a 36 on ACT Math Section with UWorld

Study content crafted by subject matter experts, assess yourself with exam-level practice, measure your performance, target your weaknesses with focused study, and repeat.
“UWorld's question bank can be described in one word: revolutionary. It accurately models the content that you would see on the test and familiarizes you with the test through PRACTICE, not mindless reading of the content. After using UWorld's amazing question bank, I was able to score a 36. It's proven to work and yielded amazingly good results for me!”
- Ravi

Create Unlimited Practice Tests with Exam-Level Questions

  • What if you could take the ACT Math as many times as you needed before it actually counted? Well, you can.
  • Study formulas and hone your computational skills with as many ACT Math practice tests as you need using hundreds of exam-level questions.
  • Customize by topic, custom tag, or even just questions you’ve previously gotten wrong.

Understand Why an Answer is Right or Wrong

  • Embracing the challenge of understanding complex mathematical formulas leads to great rewards. That's why we offer comprehensive explanations for each answer choice, along with visually engaging charts, graphs, and illustrations that unravel the intricacies, making them more accessible to grasp.
  • Plus, you can import QBank content to your customizable digital flashcards and review it anytime.

Track Your Progress With Advanced Analytics

  • Utilize your time efficiently by focusing on areas of growth and development rather than revisiting what you already know.
  • Our advanced analytics provide immediate feedback for each practice test and allow you to measure your progress with score predictors.
  • You can even compare your results to your peers. That way, you always know exactly what you need to study.

Features: My Notebook & Flashcards

  • Find a helpful explanation? Like a visualization of a formula? Just click, highlight, and select create notes or flashcards.
  • It’s easy to transfer QBank visual and written content to your digital My Notebook and Flashcards and keep them all organized by topic or custom tag.
  • The best part? It’s always in arms reach with our mobile app.

We make the real thing feel like practice

We believe that if practice feels like the actual exam, then the actual exam will feel like practice. UWorld simulates the actual ACT, so you’ll have all the confidence you need come exam day.

Practice ACT Math Questions Anywhere at Any Time

Swap social media scrolling with practicing ACT Math questions with the UWorld College Prep mobile app. Your results are automatically saved and synced across devices, allowing you to easily track your progress. Download the app today!

Hear from Our Happy Students

We measure the quality of our ACT Math practice tests and questions by the results they generate. Here’s what UWorld users have to say:

I got a 35 from studying using UWorld, it has the best question bank along with the most informative explanations.”

—Brendan

UWorld contributed to a 10 point increase for me on the ACT. The website was FANTASTIC for me to practice on the go. I especially liked the math section.”

—Anthony

The primary reason for me being extremely likely to recommend UWorld to a friend is because it has helped me prepare and achieve a 35 Composite ACT Score!

—Yosef

Frequently Asked Questions (FAQs)

Yes, the UWorld ACT Math practice tests replicate the actual structure of the ACT.
You are able to create an unlimited number of personalized practice exams. Make a new exam based on a subject, a personal tag, or merely the inquiries you’ve already gotten wrong.
An in-house team of subject-matter experts created our ACT Math practice questions and tests to match or exceed exam-level difficulty.
UWorld’s ACT Math practice tests are only available in online, or digital, format.
Yes, our advanced performance tracking tools monitor your progress by providing score predictors, identifying your weaknesses in real time, comparing your results to those of your peers, and giving you feedback summaries for each test.
Our in-house team of subject matter experts regularly updates our practice tests and questions to reflect the most recent ACT Math in both format and difficulty.
You can access practice tests digitally through the QBank interface immediately after purchase.
Our practice tests are customizable. Any student who is ready to start preparing for the ACT Math is ready to start studying with our practice tests.
Yes, all UWorld ACT products are available on your desktop computer, laptop, tablet, and smartphone. All of your data is saved and synced across devices, so you won’t lose your progress.
Achieve your dream score by consistently engaging in short study sessions that are 20 minutes to one hour long per day over several months. We advise students to begin ACT Math test preparation at least six months to a year before their scheduled exam date.
If you’re already strong in some areas of the ACT Math Test, dedicate the bulk of your study time to mastering topics and question types that you find more tricky. The performance dashboard shows you exactly which topics and questions you’ve missed. These areas offer the greatest potential for boosting your score.
You should read every ACT Math problem carefully and identify the concepts involved. Draw diagrams to simplify the problem, and try different approaches if something doesn’t work.
Identify important topics on the ACT Math section in which you struggle. Then create a measurable, overarching goal. Next, break that goal into monthly, weekly, and even daily goals.

Our ACT Math practice tests cover everything you’ll need to pass the actual exam, from Pre-algebra to Trigonometry. Check out our “About the ACT Math page” for details.

Scroll to Top