
Question
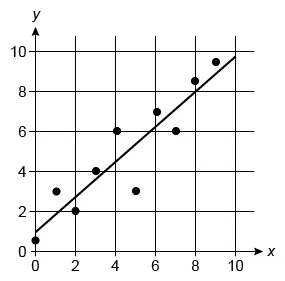
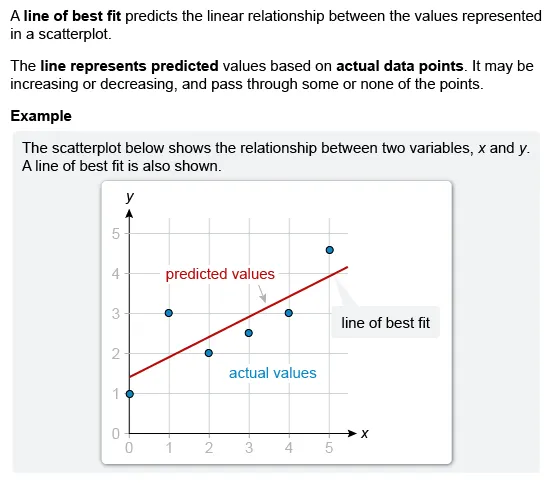
The scatterplot shows the relationship between two variables, x and y. A line of best fit is also shown. For p% of the data points, the line of best fit predicts a y-value less than the actual y-value. What is the value of p ?
Explanation
Correct Answer : 60
To find the value of p, first identify both the total number of data points and the number of data points for which the line of best fit predicts a y-value less than the actual y-value on the given scatterplot.
Count the total number of data points. A line of best fit predicts a y-value less than the actual y-value for any point (x, y) that lies above the line, so count the number of points that lie above the line.
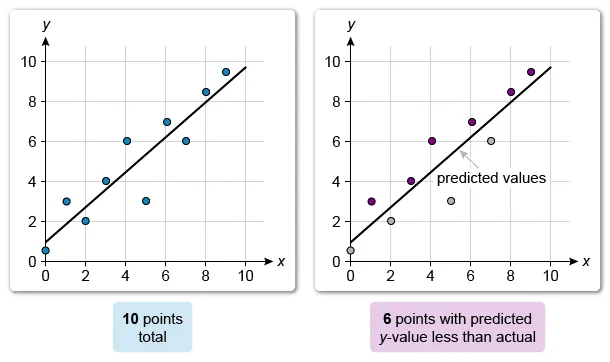
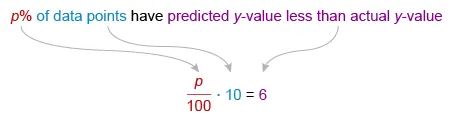
There are 10 total data points and 6 data points that have a predicted y-value that is less than the actual y-value. It is given that the line of best fit predicts a y-value less than the actual y-value for p% of the data points.
A percent of a number is equal to the percent as a fraction multiplied by that number. Rewrite p% as and write an equation.
Now solve for p.
| Multiply by 100 on both sides | |
| Divide by 100 on both sides |
The value of p is 60, which means that 60% of the data points have a predicted y-value that is less than the actual y-value.
Things to remember:
- The data points on a scatterplot represent actual values, and a line of best fit predicts a relationship between x and y based on the data points.
- A percent of a number is equal to the percent as a fraction multiplied by that number.
Question
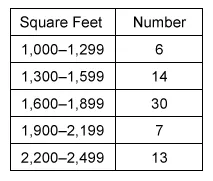
The table above gives the number of homes in a certain neighborhood that have an amount of square feet within the interval listed. Of the homes that have at least 1,600 square feet, what fraction have at least 1,900 square feet?
Explanation
Correct Answer: 2/5
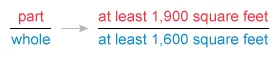
To find the desired fraction of homes, consider the desired part to the whole.
The whole is the total number of homes that have at least
1,600 square feet.
The part is the number of those that have at least
1,900 square feet.
To find the number of homes that have at least 1,900 sq ft,
identify the rows that include intervals of 1,900 or more.
To find the number of homes that have at least 1,600 sq ft,
identify the rows that include intervals of 1,600 or more.
Then add the corresponding numbers of homes to find the values of the part and the whole.
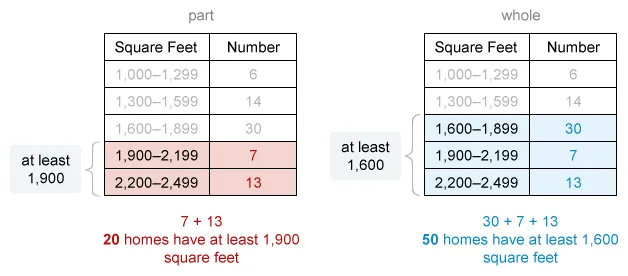
Of the 50 homes that have at least 1,600 square feet, 20 have at least 1,900 square feet.
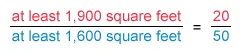
It is not possible to grid the value , so it is necessary to rewrite to fit the grid. Of the homes that have at least 1,600 square feet, the fraction that have at least 1,900 square feet is .
Things to remember:
A fraction represents a part (numerator) of a whole (denominator).
Question
It is estimated that an average raindrop has a mass of 34 milligrams and falls at a constant speed of 1,200 centimeters per second. How far, in centimeters, would a raindrop of this size fall in 12 seconds?
| A.144,000 | |
| B. 40,800 | |
| C.14,400 | |
| D. 408 |
Explanation
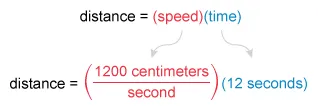
An object moving at a constant speed travels a distance equal to the product of its speed and the time of travel.

It is given that a raindrop falls at a constant speed of 1,200 centimeters per second. To find the distance that the raindrop falls in 12 seconds, plug these values for speed and time into the distance equation.
Now cancel units and multiply to find the distance in centimeters.
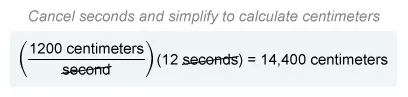
In 12 seconds, a raindrop with the given speed will travel 14,400 centimeters.
Note: The given mass (34 milligrams) is extra information and is not needed to answer this question.
(Choice A) 144,000 is the distance in millimeters (instead of centimeters) and may result from mistakenly multiplying 12,000 (instead of 1,200) by 12 seconds.
(Choices B and D) 40,800 and 408 may result from mistakenly multiplying the given speed (1,200) or the given time (12) by the given mass (34 grams).
Things to remember:
An object moving at a constant speed travels a distance equal to the
product of its speed and the time of travel.
Question
A garden shop has a display of plants for sale. Each plant is either a flower or a vegetable and is either organic or nonorganic. The probability of randomly selecting a plant that is a flower is 0.4. The probability of randomly selecting a plant that is nonorganic and is a vegetable is 0.1. If the display holds 80 plants, how many are vegetables that are organic?
| A.32 | |
| B.40 | |
| C.48 | |
| D.72 |
Explanation
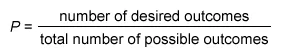
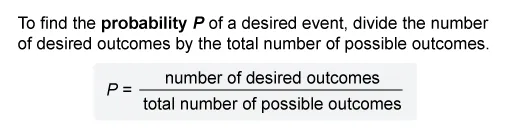
To find the probability P of a desired event, use the following formula:
Use the given probabilities to find the number of vegetable plants and the number of nonorganic vegetable plants. Then subtract to find the number of organic vegetable plants.
Vegetable plants
The given probability of randomly selecting a plant that is a flower is 0.4.
The number of possible outcomes is the given total
number of plants (80).
The number of desired outcomes is the number of
those plants that are flowers.
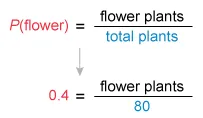
Solve for the number of flower plants.
| Probability | |
| Multiply both sides by 80 to clear the fractions | |
| Simplify |
Of the 80 plants, 32 are flowers and the rest are vegetables.
Subtract to find that there are 80 − 32 = 48 vegetable plants.
Nonorganic vegetable plants
The given probability of randomly selecting a plant that is a nonorganic vegetable is 0.1.
The number of possible outcomes is the total number
of plants (80).
The number of desired outcomes is the number of those
plants that are nonorganic vegetables.
Solve for the number of nonorganic vegetable plants.
| Multiply by both sides by 80 to clear the fractions | |
| Simplify |
There are 8 nonorganic vegetable plants.
There are 48 vegetable plants and 8 of them are nonorganic, so the rest are organic.
Subtract the number of nonorganic vegetable plants (8) from the total number of vegetable plants (48) to find that 48 − 8 = 40 plants are vegetables that are organic.
(Choice A) 32 is the number of plants that are flowers, but the question asks for the number of plants that are vegetables and organic.
(Choice C) 48 is the number of plants that are vegetables, but the question asks for the number of plants that are vegetables and organic.
(Choice D) 72 may result from mistakenly subtracting the number of plants that are vegetable and nonorganic (8) from the total number of plants (80) instead of from the number of plants that are vegetables (48).
Things to remember:
The probability of a desired event is equal to the number of desired
outcomes divided by the total number of possible outcomes.
Alternate Method :
It is also possible to first calculate the probability of randomly selecting an organic vegetable plant and then use the probability formula to find the number of organic vegetable plants.
It is given that the plants are either flower or vegetable. Therefore, the event that a plant is a vegetable is the complement of the event that a plant is a flower.
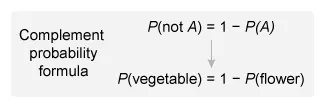
It is given that the probability of selecting a plant that is a flower is 0.4. Plug P(flower) = 0.4 into the complement probability formula and solve for P(vegetable) to find the probability of selecting a plant that is a vegetable.
| P(vegetable) = 1 − P(flower) | Complement formula |
| P(vegetable) = 1 − 0.40 | Plug in P(flower) = 0.4 |
| P(vegetable) = 0.60 | Subtract |
The probability of selecting a plant that is a vegetable is 0.6, and the given probability of selecting a plant that is nonorganic and a vegetable is 0.1.
Every vegetable is either nonorganic or organic, so the probabilities of nonorganic vegetable (0.1) and organic vegetable must add to the probability of vegetable (0.6).
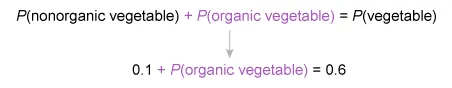
Subtract to find that the probability of selecting a plant that is organic and a vegetable is 0.6 − 0.1 = 0.5.
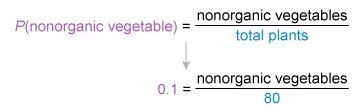
The probability of selecting a plant that is organic and a vegetable (0.5) is equal to the number of organic vegetables divided by the total number of plants (80). Plug these values into the probability formula.
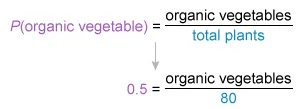
Solve for the number of organic vegetable plants.
| Multiply both sides by 80 to clear the fractions | |
| Simplify |
Of the plants on display, 40 are vegetables that are organic.
Things to remember:
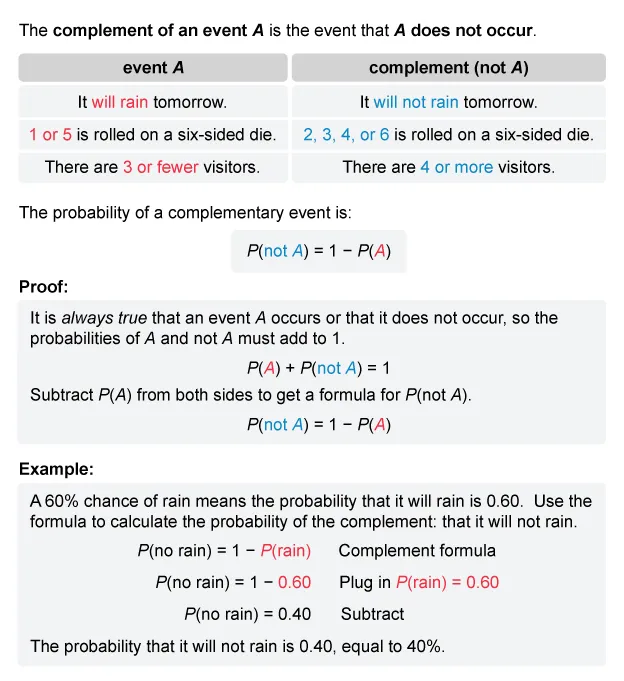
- The complement of an event A is the event that A does NOT occur. The probability that an event A does NOT occur, P(not A), is equal to 1 minus the probability that it does occur, P(A):
P(not A) = 1 − P(A)
- To find the probability of a desired event, use the following formula:
Question
The price of a discounted one-way bus ticket is $54.00. The discounted price is 40% less than the original price of the bus ticket. What was the original price of the bus ticket? (Assume there is no sales tax.)
| A.$21.60 | |
| B.$32.40 | |
| C.$90.00 | |
| D.$135.00 |
Explanation
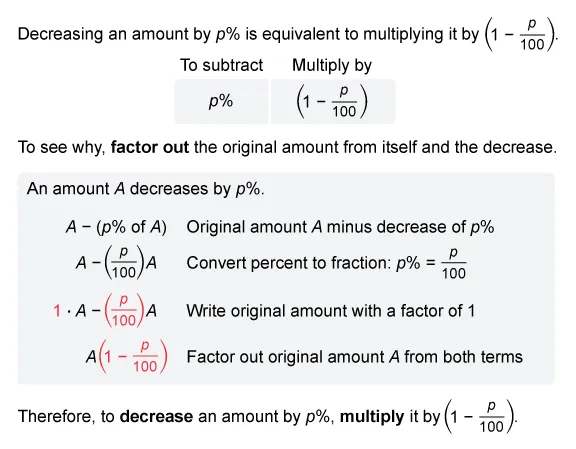
It is given that the discounted ticket price is 40% less than the original ticket price, so the discounted price $54 is the result of a 40% decrease of the original price. To decrease an amount by p%, multiply it by (proof).
The original price multiplied by is equal to the discounted price. Let the original price be x, and write an equation to relate the original price (x), the given percent decrease (p = 40), and the discounted price (54).
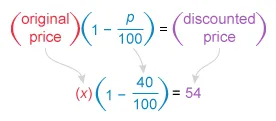
Now solve the equation for x, the original price.
| Simplify: | |
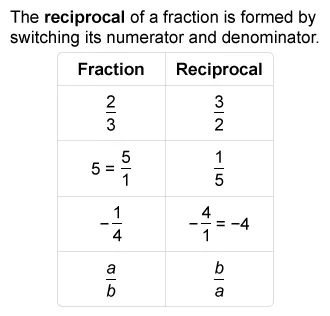
| Multiply both sides by the reciprocal to isolate x | |
| Simplify: |
The original price of the bus ticket was $90.
(Choice A) $21.60 is 40% of the discounted price and may result from mistakenly multiplying $54 by , instead of dividing $54 by .
(Choice B) $32.40 is 60% of the discounted price and may result from mistakenly multiplying (instead of dividing) the discounted amount $54 by .
(Choice D) $135.00 would be the original price if there was a 60% discount (instead of 40%) and may result from mistakenly dividing the discounted price $54 by (instead of ).
Things to remember:
-
A discounted price that is p% less than an original price is equivalent to decreasing the original price by p%.
-
To decrease a value by p%, multiply it by :


