


Question
The Department of Education of a particular state conducted a study of high school students by selecting 100 random samples, each consisting of 50 high school students. The grade point averages (GPAs) for Precalculus and total SAT scores in each sample were recorded. A 90 percent confidence interval for the slope of the linear regression line between Precalculus GPA and total SAT scores for all high school students was created for each sample. Which of the following is true about the confidence level?
| A. It is expected that about 10 of the 100 confidence intervals will not contain the sample slope of the linear regression line. | |
| B. It is expected that about 90 of the 100 confidence intervals will be identical because they were constructed from samples of the same size from the same population. | |
| C. It is expected that about 90 of the 100 confidence intervals will contain the slope of the linear regression line for all high school students in the state. | |
| D. The probability is 0.90 that 100 confidence intervals will yield the same information about the sample linear regression line. | |
| E. There is 90% confidence that the point estimate of the slope of the linear regression line is correct for each sample. |
Hint:
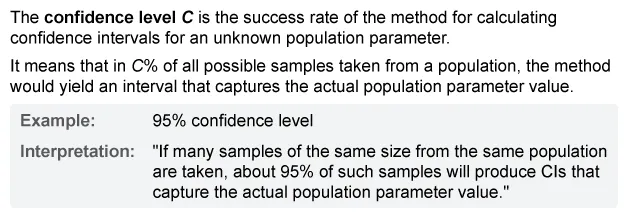
The C% confidence level represents the confidence with which an interval includes the true population parameter (ex. population slope).
Explanation
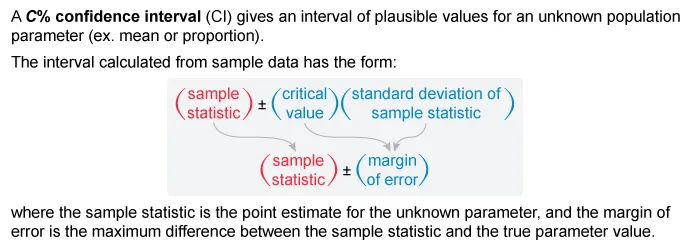
A C% confidence interval (CI) is a range of plausible values calculated from sample data that captures the true population parameter's value with a C% confidence level.
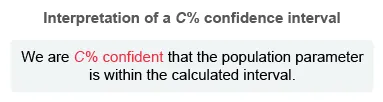
The C% confidence level refers to the percentage of samples of the same size that are expected to result in a CI that includes the true population parameter (ex. slope of the linear regression).

Of the choices, only Choice C defines the confidence level as the percentage of CIs expected to contain the population parameter value. Therefore, the following statement is the best interpretation:
| It is expected that about 90 of the 100 confidence intervals will contain the slope of the linear regression line for all high school students in the state. |
(Choice A) CIs are constructed around a sample statistic (ex. slope), so all CIs will contain the sample slope of the linear regression line.
(Choice B) The confidence level refers to a percentage of CIs expected to contain the population slope, not to the percentage of intervals that will be identical. Samples of the same size from the same population result in different sample statistics (ex. slope), so the intervals are unlikely to be identical.
(Choice D) The confidence level refers to a percentage of CIs expected to contain a population parameter (population slope), not the probability that the sample statistic (sample slope) is correct.
(Choice E) The confidence level refers to a percentage of CIs expected to contain the population slope, not the probability that a certain number of CIs will yield a specific set of values. The probability that a single CI will contain the true population parameter is either 0% or 100%.
Things to remember:
- A C% confidence interval (CI) is a range of plausible values calculated from sample data that captures the true value of a population parameter with a C% confidence level.
- The C% confidence level refers to the percentage of samples of the same size that are expected to result in a CI that includes the true population parameter (ex. population slope).
Question
A molecular biologist is interested in the relationship between the caffeine content of green coffee beans and the altitude at which the beans are grown. The biologist collected data on the altitude (in hundreds of meters) and average caffeine content (%) from a random sample of 40 green coffee bean batches in a certain region. A 95 percent confidence interval for the slope of the linear regression line of caffeine content on altitude is determined to be (−0.025, −0.011). Which of the following is a correct interpretation of the interval?
| A. We are confident that the probability is 0.95 that a different sample of 40 green coffee bean batches will result in an increase, on average, of caffeine content between 0.011 and 0.025 percent for each 100-meter increase in altitude. | |
| B. We are confident that the probability is 0.95 that caffeine content will decrease, on average, between 0.011 and 0.025 percent for each 100-meter increase in altitude. | |
| C. We are 95% confident that, for any sample of green coffee bean batches, the caffeine content will decrease, on average, between 0.011 and 0.025 percent for each 100-meter increase in altitude. | |
| D. We are 95% confident that the caffeine content increases, on average, between 0.011 and 0.025 percent for each 100-meter increase in altitude. | |
| E. We are 95% confident that the caffeine content decreases, on average, between 0.011 and 0.025 percent for each 100-meter increase in altitude. |
Hint:
A confidence interval is an interval of plausible values that, with a specific level of confidence, should contain the unknown value of a population parameter.
Explanation
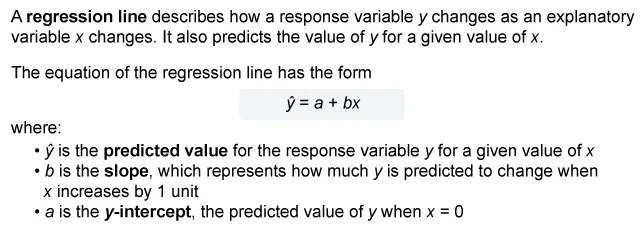
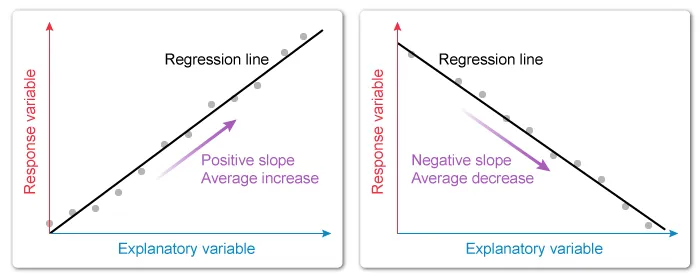
The slope of a regression line is the average change in the response variable per unit increase in the explanatory variable.
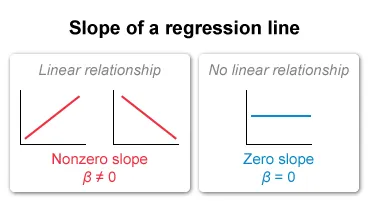
A positive slope represents an average increase in the response variable as the explanatory variable increases.
A negative slope represents an average decrease in the response variable as the explanatory variable increases.
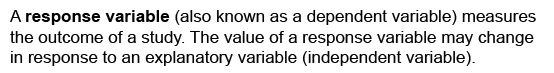
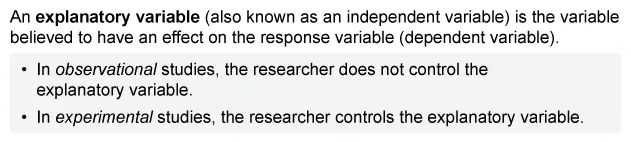
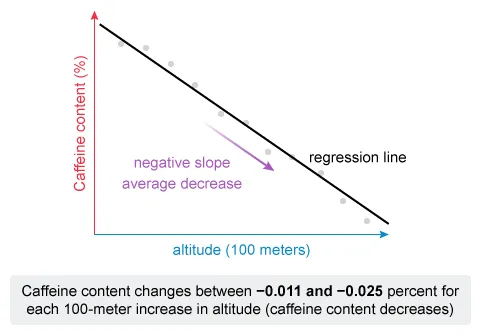
It is given that a molecular biologist conducted a regression analysis of caffeine content on altitude, so caffeine content is the response variable and altitude is the explanatory variable.
Notice that the given interval (−0.025, −0.011) for the slope of the regression line contains only negative values, so caffeine content decreases (on average) as altitude increases. Eliminate Choices A and D.
Now consider the definition of a confidence interval (CI).
Therefore, the correct interpretation of the interval is that we are 95% confident that the caffeine content decreases, on average, between 0.011 and 0.025 percent for each 100-meter increase in altitude.
(Choices A and D) The given CI (−0.025, −0.011) contains only negative values, so the caffeine content is expected to decrease (rather than increase) on average as altitude increases.
(Choice B) A confidence level does not calculate the probability that the slope of a population regression line is within the CI. The probability that the slope of a population regression line is in the interval is either 0% or 100%.
(Choice C) A CI provides an interval of plausible values for the slope of the population regression line. Each sample may result in a different 95% CI for the slope due to sampling variation.
Things to remember:
- The slope of a regression line is the average change in the response variable per unit increase in the explanatory variable.
- A confidence interval (CI) gives an interval of plausible values that, with a C% level of confidence, should capture the unknown population parameter.
Question
A doctoral-level kinesiology student selected a random sample of female students registered at the campus recreation center and collected data on their cardio fitness score and body mass index (BMI). She wants to calculate a 90 percent confidence interval for the slope of the regression line of cardio fitness score on BMI in the population of female students registered at the campus recreation center. Which of the following statements must be true in this situation to use a t-interval for the slope?
- The variability of cardio fitness scores is the same for all BMI values.
- The mean of the cardio fitness scores is the same for all BMI values.
- The mean of the cardio fitness scores changes at different rates as BMI values increase.
| A. I only | |
| B. II only | |
| C. III only | |
| D. I and II only | |
| E. I and III only |
Hint:
Consider the conditions in which a t-test for the slope is valid (independence, linear relationship, approximately normal distribution of the response, and constant variability of the response).
Explanation
A student will use a t-interval to construct an interval for the slope of the regression line of cardio fitness score (response variable) on body mass index (BMI) (explanatory variable) in the population of female students at the recreation center.
A t-interval to estimate the slope of the population regression line is valid under the following conditions:
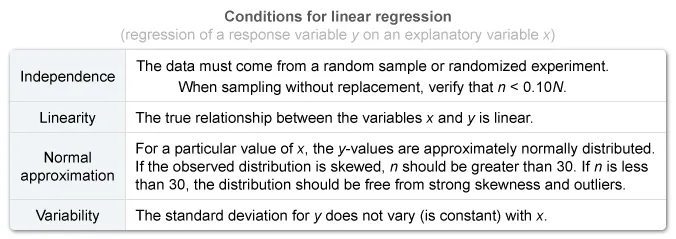
Consider each statement and determine which must be true to use a t-interval to estimate a regression slope.
Statement I: The variability of cardio fitness scores is the same for all BMI values.
The t-interval for the slope requires that the variability (standard deviation) of the response variable (cardio fitness score) does not vary with the explanatory variable (BMI).

Statement I must be true to use a t-interval for a slope, so eliminate Choices B and C.
Statement II: The mean of the cardio fitness scores is the same for all BMI values.
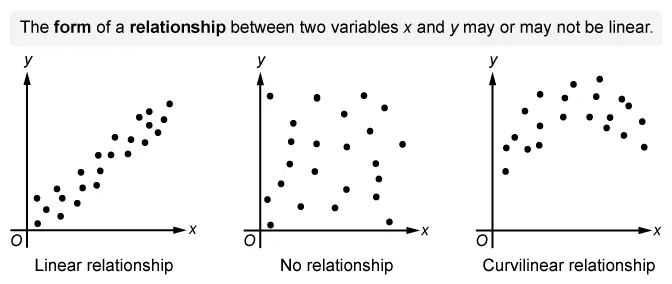
For a linear relationship, the mean of the response variable is not constant across the values of the explanatory variable.
If there is no relationship, the mean of the response variable may be constant across the values of the explanatory variable. Statement II does not need to be true, so eliminate Choices B and D.
Note: If the mean of the response variable is constant across the values of the explanatory variable, then the slope is zero (no linear relationship).
Statement III: The mean of the cardio fitness scores changes at different rates as BMI values increase.
The t-interval for the slope requires that the relationship between the response (cardio fitness score) variable and the explanatory variable (BMI) be linear.
For a linear relationship, an increase in the explanatory variable results in a constant change in the mean of the response variable. Statement III is not true for a linear relationship, so eliminate Choices C and E.
Of the given statements, only Statement I must be true to use a t-interval for the slope in this situation.
|
Things to remember:
- A t-interval for the slope of the regression line estimates the slope of the population regression line.
- The conditions for a t-test for the slope to be valid are independence, linear relationship, approximately normal distribution of the response, and constant variability of the response.

UWorld’s service is pretty good and helps provide a lot of explanations on subjects I haven’t been confident on before.
The questions here are the most realistic to the AP tests I've seen so far! I appreciate the ability to customize tests as well.
The best part is that all options are well-explained, telling clearly why they are not the right option.