


Question
A national research group conducted an internet survey in which random samples of 2,000 people who own their home and 2,000 people who rent their home were asked what characteristic of their current living arrangements they consider to be the most desirable. The results of the survey are summarized in the table below.
| Characteristic | |||||
|---|---|---|---|---|---|
| Monthly Costs | Location | Property Features | Size of Living Area | Other | |
| Homeowner | 1,100 | 520 | 195 | 75 | 110 |
| Renter | 950 | 798 | 135 | 45 | 72 |
What is the contribution to the chi-square statistic for homeowners who answered that the size of the living area was the most desirable characteristic?
| A. 0.25 | |
| B. 3 | |
| C. 3.75 | |
| D. 60 | |
| E. 75 |
Hint:
The chi-square statistic is for the chi-square test for homogeneity of proportions.
Explanation
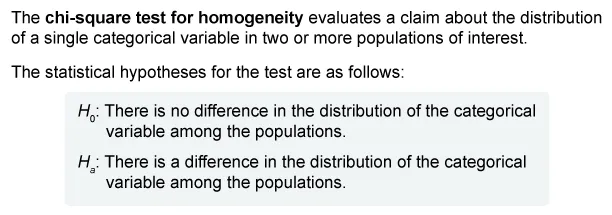
The appropriate hypothesis test to compare the distribution of a categorical variable (characteristic) in two or more populations (homeowners and renters) is the chi-square test for homogeneity of proportions.
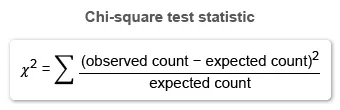
When the conditions for inference are met, use the following formula to calculate a chi-square test statistic (χ²) for the chi-square test of homogeneity.
The individual contribution of a cell is . To determine the contribution of homeowners who answered that the size of the living area was the most desirable characteristic, calculate the observed and expected counts.
Identify the observed cell count of homeowners who said that the size of living area was the most desirable characteristic (75) from the table. Now use the following formula to calculate the expected cell count:
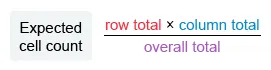
It is given that the overall total is 4,000 (2,000 homeowners and 2,000 renters). Use the table to determine that the row total for homeowners is 2,000 and the column total for characteristic is 120 (calculation).
| Expected Cell Count | |
| Plug in row total = 2,000, column total = 120, and overall total = 4,000 | |
| 60 | Simplify |
Plug the expected count (60) and the observed count (75) into the chi-square statistic formula.
| Contribution to chi-square statistic | |
| Plug in observed cell count = 75 and expected cell count = 60 | |
| 3.75 | Simplify |
Therefore, the contribution to the chi-square statistic for homeowners who answered that the size of the living area was the most desirable characteristic is 3.75.
(Choice A) 0.25 results from mistakenly using (Observed Count − Expected Count) as the numerator of the formula for the contribution the chi-square statistic, rather than (Observed Count − Expected Count)².
(Choice B) 3 results from mistakenly using the observed count rather than the expected count as the denominator of the formula for the contribution of the chi-square statistic.
(Choices D and E) 60 and 75 are the expected count and observed count of homeowners who answered that the size of the living area was the most desirable characteristic.
Things to remember:
- The appropriate hypothesis test to compare the distribution of a categorical variable (characteristic) in two or more populations is the chi-square test for homogeneity of proportions.
- The individual contribution of a cell to the chi-square statistic is .
Question
Consider again the survey of road conditions. For that survey, the researcher conducted an email-based survey of residents living in a large city in the northern U.S. The residents were asked in which region of the city they lived and how they would rate the roads in the city.
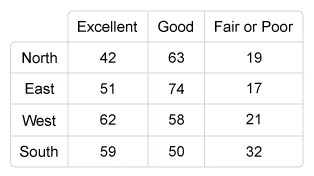
If the researcher instead selected separate random samples of 125 residents living in each region to rate the roads, which of the following procedures would be most appropriate to use for determining if the distribution of road ratings differs among the regions?
| A. Chi-square goodness-of-fit test | |
| B. Chi-square test of independence | |
| C. Chi-square test of homogeneity |
Explanation
It is given that the researcher selected separate random samples of 125 residents living in each region to rate the roads (a stratified sample). The test that compares the distribution of a categorical variable (how residents rate the roads) across different populations (city regions) is the chi-square test of homogeneity.
Question
A researcher conducted an email-based survey of residents living in a large city in the northern U.S. The residents were asked in which region of the city they lived and how they would rate the roads in the city.
Which of the following procedures would be most appropriate to use for determining whether there is a relationship between where people live and how they rate the roads?
| A. Chi-square goodness-of-fit test | |
| B. Chi-square test of independence | |
| C. Chi-square test of homogeneity |
Explanation
It is given that a single sample of residents living in a large city in the northern U.S. was selected and each resident was categorized based on the region of the city in which they lived and how they would rate the roads in the city. The test that evaluates the relationship between two categorical variables (city regions and how residents rate the roads) is the chi-square test of independence.

UWorld’s service is pretty good and helps provide a lot of explanations on subjects I haven’t been confident on before.
The questions here are the most realistic to the AP tests I've seen so far! I appreciate the ability to customize tests as well.
The best part is that all options are well-explained, telling clearly why they are not the right option.