


Question
Which of the following statements is true about the t-distribution?
- It is symmetric.
- It is more spread out than the standard normal distribution.
- As the degrees of freedom get smaller, its dispersion gets smaller.
| A. I only | |
| B. II only | |
| C. III only | |
| D. I and II only | |
| E. I, II, and III |
Hint:
The t-distribution is a continuous probability distribution similar to the standard normal distribution. Its spread depends on the degrees of freedom, which is defined differently for different hypothesis tests.
Explanation
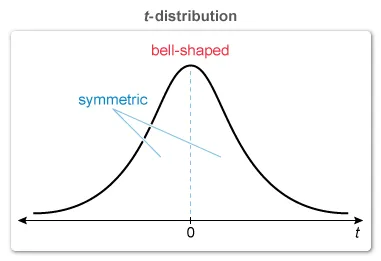
A t-distribution is a continuous probability distribution that is similar in many aspects to the standard normal distribution: bell-shaped and symmetric. Statement I is true.
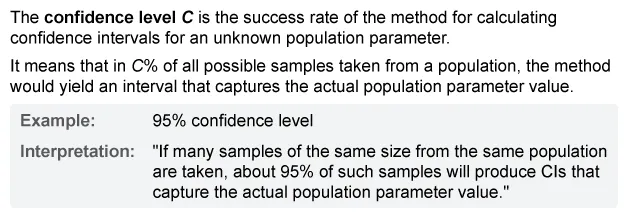
The spread of the t-distribution depends on the degrees of freedom (df), the value of which is defined differently for different hypothesis tests.
An increase in df makes the t-distribution less spread out and closer to the standard normal distribution. A decrease in df makes the t-distribution more spread out and farther from the standard normal distribution.
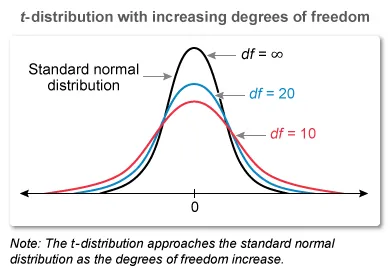
The t-distribution is always more spread out than the normal distribution, and its dispersion gets larger (not smaller) as the degrees of freedom get smaller. Statement II is true, but Statement III is false.
Therefore, of the given statements, only I and II are true.
Things to remember:
A t-distribution is a continuous probability distribution, and (similar to the standard normal distribution) it is bell-shaped and symmetric. The spread of the t-distribution depends on the degrees of freedom (df):
An increase in df makes the t-distribution less spread out and closer to the normal distribution.
A decrease in df makes the t-distribution more spread out and farther from the normal distribution.
Question
A doctor conducted a small study to investigate fasting blood sugar levels in adult patients with diabetes. A random sample of 20 people was selected from the names of all his patients who have diabetes. Of the people in the sample, the mean fasting blood sugar level was 182.23 milligrams per deciliter (mg/dL) with a standard deviation 12.67 mg/dL. The doctor decided to construct a 90 percent confidence interval for the mean fasting blood sugar level, in mg/dL, of all his patients with diabetes. Assuming all conditions for inference are met, which of the following is closest to the critical value for the 90 percent confidence interval?
| A. 1.282 | |
| B. 1.327 | |
| C. 1.645 | |
| D.1.729 | |
| E. 1.960 |
Hint:
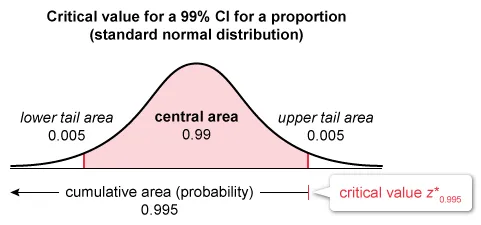
A critical value is a boundary used to identify the middle C% of a probability distribution, where C% is the confidence level of a confidence interval.
Explanation
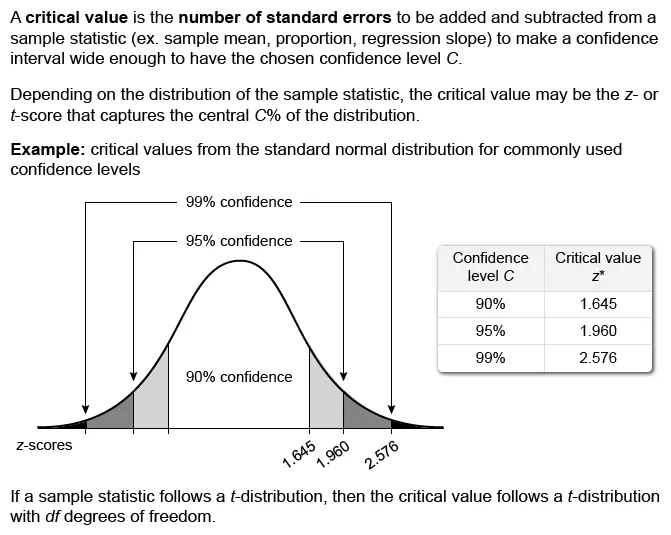
A critical value is a boundary used to identify the middle C% of a probability distribution, where C% is the level of confidence of a confidence interval (CI). It is the multiplier that makes a CI wide enough to have C% confidence level..
The doctor will construct a CI for a population mean μ (mean fasting blood glucose level of all his patients with diabetes). The critical value for a CI for μ depends on the method used to construct the CI.

No information is given about the population, so assume that the population SD is unknown. The proper method to construct the CI is a t-interval, and the critical value is a t-score (t*).
The critical value t* of a 90% CI for μ is the t-score that captures the central 90% (and accumulates 95%) of the area under the t-distribution with degrees of freedom (df) equal to the sample size n minus one: n − 1.
It is given that a random sample of 20 people was selected, so the critical value t* is the t-score that accumulates 95% of the area under the t-distribution with 20 − 1 = 19 df. The notation for the critical value t* is t19, 0.95.
| To find t19, 0.95, first locate the inverse t-distribution (invt) function on a calculator. Input the area under the curve for a 90% CI (cumulative area = 0.95) and df = 19. |
The answer choice that is closest to the critical value for the 90% CI for the mean fasting blood glucose level of all the doctor's patients with diabetes is t* = 1.729.
Note: It is possible to determine the critical t-score (t*) using a t-distribution table (see table).
(Choice A) This choice results from the error described in Choice C and from mistakenly determining the critical value for an 80% CI (1.282).
(Choice B) This choice results from mistakenly determining the critical value for an 80% CI (t19, 0.90 = 1.327) instead of the critical value for a 90% CI (t19, 0.95 = 1.729).
(Choice C) This choice results from mistakenly finding the critical value for a z-interval (based on the standard normal distribution), but the appropriate interval is a t-interval because the population SD is unknown.
(Choice E) This choice results from the error described in Choice C and from mistakenly determining the critical value for a 95% CI (1.960).
Things to remember:
- Use a t-interval to construct a confidence interval (CI) for a mean μ when the conditions for inference are met and standard deviation (SD) of the population is unknown.
- The critical value t* for a C% CI for μ is the t-score that captures the central C% of the area under the t-distribution with degrees of freedom (df) equal to n − 1.
Question
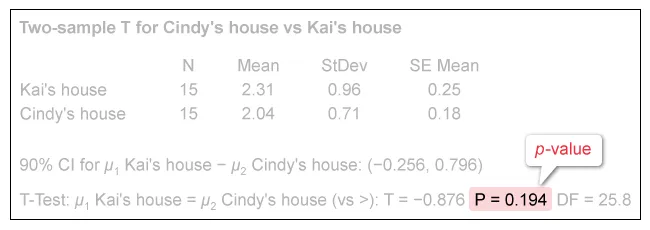
Jane and Ryan are best friends. They live in different cities and take a train whenever they visit each other. Jane believes that it takes her longer to get to Ryan than it does for Ryan to get to her. Jane and Ryan decided to collect data to see if her train transit time is longer than his. They recorded the transit time in hours. After convincing themselves that the assumptions were reasonable, they conducted a two-sample t-test and obtained the following results.
| Two-sample T for Jane's transit time vs Ryan's transit time | ||||
| N | Mean | StDev | SE Mean | |
| Jane's transit time | 15 | 2.31 | 0.96 | 0.25 |
| Ryan's transit time | 15 | 2.04 | 0.71 | 0.18 |
| 90% CI for μ1 Jane's transit time − μ2 Ryan's transit time: (−0.256, 0.796) | ||||
| T-Test: μ1 Jane's transit time = μ2 Ryan's transit time (vs >): T = 0.876, P = 0.194, DF = 25.8 | ||||
Using a significance level of 0.10, which of the following statements best describes the conclusion that can be drawn from these data?
| A. There is convincing evidence that the mean transit time for Jane is greater than the mean transit time for Ryan. | |
| B. There is not convincing evidence that the mean transit time for Jane is greater than the mean transit time for Ryan. | |
| C. There is convincing evidence to conclude that there is a difference in the mean transit time between Jane and Ryan. | |
| D. There is not convincing evidence to conclude that there is a difference in the mean transit time between Jane and Ryan. | |
| E. The t-test cannot be used for samples that are this small. |
Hint:
Use the p-value to determine the statistical significance of the appropriate hypothesis test.
Explanation
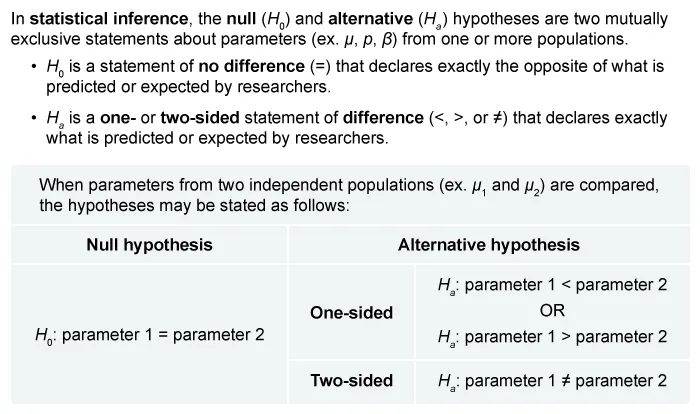
To draw conclusions about the given data, first identify the null H0 and alternative Ha hypotheses. Then compare the p-value to the significance level α to determine if there is convincing evidence in favor of Ha.
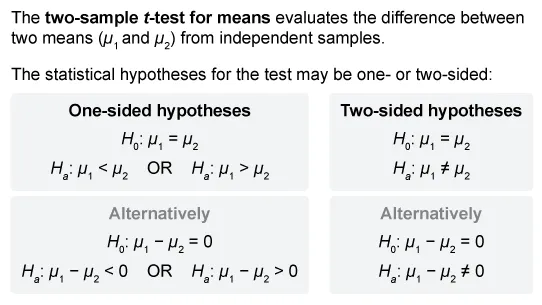
It is given that a two-sample t-test was conducted to determine whether the mean transit time for Jane (µ1) is greater than the mean transit time for Ryan (µ2), so H0 and Ha are the following:

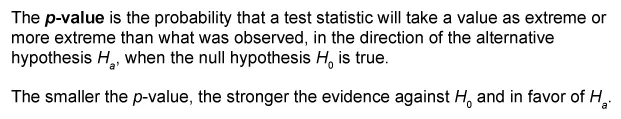
If p-value ≤ α, there is convincing evidence that Ha is true (mean transit time is greater for Jane than for Ryan).
If p-value > α, there is not convincing evidence that Ha is true (mean transit time is not greater for Jane than for Ryan).
Notice that the given p-value is greater than the significance level α (0.194 > 0.10), so there is not convincing evidence in favor of Ha.

Therefore, the most appropriate conclusion that can be drawn from the data is:
| There is not convincing evidence that the mean transit time for Jane is greater than the mean transit time for Ryan. |
(Choice A) The p-value is greater than the significance level α, so there is not convincing statistical evidence in favor of Ha.
(Choices C and D) These choices describe conclusions based on a two-sided hypothesis test, which evaluates if there is a difference between two means. However, the question asks for a one-sided test, which evaluates if one mean is greater than another.
(Choice E) The sample size is sufficient to conduct the test because the question states that the assumptions were reasonable to conduct the test.
Things to remember:
To determine whether there is convincing statistical evidence against a null hypothesis H0 and in favor of an alternative hypothesis Ha, compare the p-value to the significance level α.
- If p-value ≤ α, there is convincing evidence in favor of Ha.
- If p-value > α, there is not convincing evidence in favor of Ha.

UWorld’s service is pretty good and helps provide a lot of explanations on subjects I haven’t been confident on before.
The questions here are the most realistic to the AP tests I've seen so far! I appreciate the ability to customize tests as well.
The best part is that all options are well-explained, telling clearly why they are not the right option.