


Question
A researcher found that a large-sample 95 percent confidence interval for the proportion of subscriptions that are not canceled before the end of a free trial period is (0.056, 0.124). What is the point estimate for the proportion of subscriptions that are not canceled before the end of the free trial period from which this interval was constructed?
| A. 0.034 | |
| B. 0.068 | |
| C. 0.090 | |
| D. 0.180 | |
| E. It cannot be determined from the information given. |
Hint:
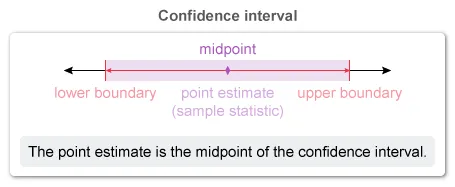
A confidence interval has the general form: point estimate ± margin of error.
Explanation
A confidence interval (CI) adds and subtracts a margin of error from a point estimate (sample statistic), so the point estimate is the midpoint of the interval.
It is given that the CI is (0.056, 0.124), so the point estimate must be the midpoint value between 0.056 and 0.124. Eliminate Choices A and D because those values are either below 0.056 or above 0.124.
The midpoint of an interval is equal to the sum of its endpoints divided by 2. To find the midpoint of the given interval, add the lower boundary (0.056) to the upper boundary (0.124) and then divide by 2.

Therefore, the point estimate for the proportion of subscriptions that are not canceled before the end of the free trial period from which this interval was constructed is 0.090.
Note: Point estimates are always at the center of the confidence interval (except in rare cases that will not appear on the exam).
(Choices A and B) These choices may result from mistakenly subtracting the lower boundary from the upper boundary, but it is necessary to add them together and then divide that result by 2.
(Choice D) 0.180 may result from not dividing the sum of the lower and upper boundaries by 2.
(Choice E) This choice may result from a misconception about how an interval is constructed. The point estimate is always contained in the interval constructed from the same sample data.
Things to remember:
A confidence interval adds and subtracts a margin of error from a point estimate (sample statistic), so the point estimate is the midpoint of the interval (except for rare cases that do not appear on the AP exam).
Question
A marketing firm is asked to estimate the proportion of homes in a city with landline phones. A random sample of 150 adult residents were surveyed to determine whether they have a landline phone in their home. Of the people surveyed, 35 percent responded that they have a landline phone. The firm decides to construct a 99 percent confidence interval to estimate the true proportion of homes in the city with landline phones. Assuming all conditions for inference are met, which of the following is closest to the critical value for the 99 percent confidence interval?
| A. 1.645 | |
| B. 1.960 | |
| C. 2.326 | |
| D.2.576 | |
| E. 2.609 |
Hint:
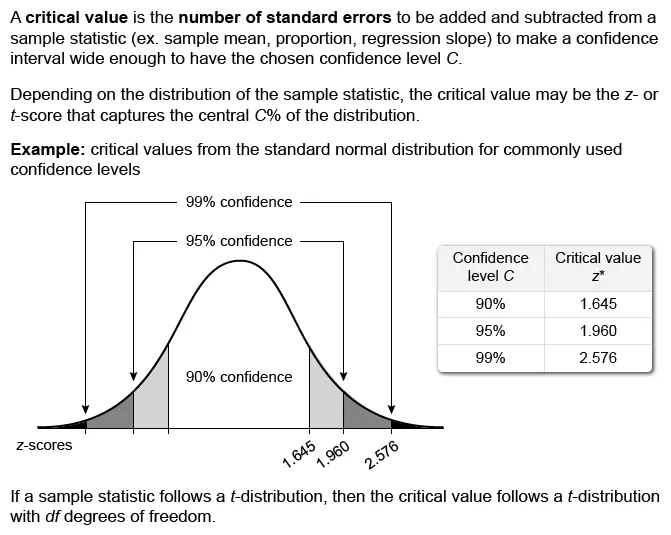
A critical value is a boundary used to identify the middle C% of a probability distribution, where C% is the confidence level of a confidence interval.
Explanation
A critical value is a boundary used to identify the middle C% of a probability distribution, where C% is the level of confidence of a confidence interval (CI). It is the multiplier that makes a CI wide enough to have C% confidence.
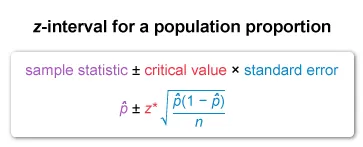
A marketing firm will construct a CI to estimate the true proportion p of city homes with landlines. When conditions for inference are met, the CI for a proportion is a z-interval, and the critical value is a z-score (z*).
The critical value z* of a 99% CI for p is the z-score that captures the central 99% (and accumulates 99.5%) of the area under the standard normal distribution (z-distribution). The notation for the critical value z* is z0.995.
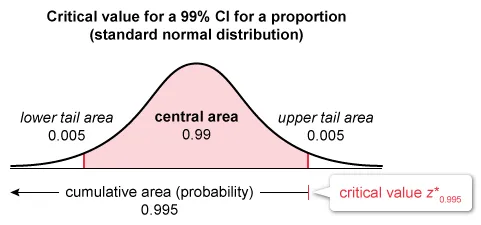
| To find z0.995, first locate the inverse normal distribution (invNorm) function on a calculator. Input the area under the curve for a 99% CI (cumulative area = 0.995), the mean (0) and standard deviation (1) of the standard normal distribution, and then specify the required tail area (left). |
The answer choice closest to the critical value for the 99% CI for the proportion of adults living in the city who have landline phones is z* = 2.576.
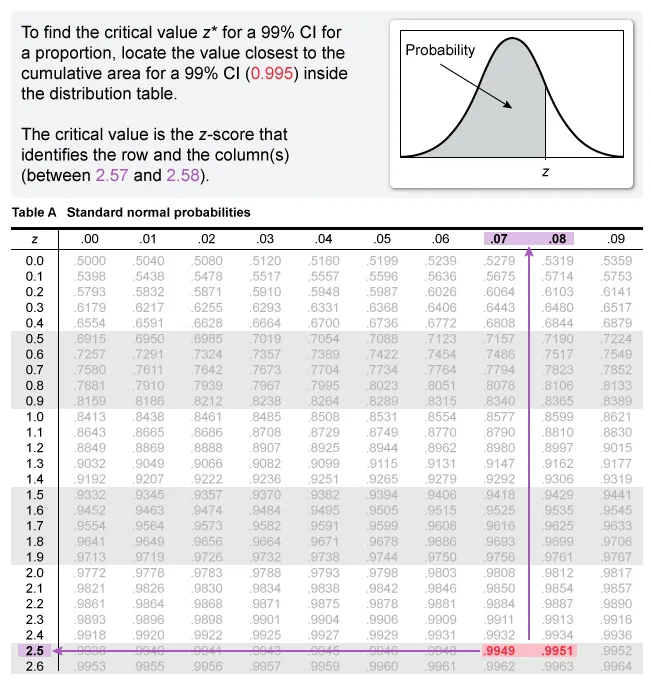
Note: It is possible to determine the critical z-score (z*) with the normal distribution table (see table).
(Choice A) 1.645 results from mistakenly determining the critical value for a 90% CI (z0.95 = 1.645) instead of the critical value for a 99% CI (z0.995 = 2.576).
(Choice B) 1.960 results from mistakenly determining the critical value for a 95% CI (z0.975 = 1.960) instead of the critical value for a 99% CI (z0.995 = 2.576).
(Choice C) 2.326 results from mistakenly determining the critical value for a 98% CI (z0.99 = 2.326) instead of the critical value for a 99% CI (z0.995 = 2.576).
(Choice E) 2.609 results from mistakenly determining the critical value of the CI based on t-distribution with 150 − 1 = 149 degrees of freedom (t149, 0.995 = 2.609) rather than the normal distribution (z0.995 = 2.576).
Things to remember:
- Use a z-interval to construct a confidence interval (CI) for a population proportion p when the conditions for inference are met.
- The critical value z* for a C% CI for p is the z-score that captures the central C% of the area under the standard normal distribution.
Question
Researchers conducted a survey of 210 randomly selected female professional athletes and 290 randomly selected male professional athletes in a large city. The athletes were asked whether they owned a fitness smartwatch. A total of 180 female athletes and 261 male athletes reported owning a fitness smartwatch. An appropriate hypothesis test was conducted to investigate whether there was a difference between female and male professional athletes in their ownership of a fitness smartwatch. Assuming that conditions for inference are met, is there convincing statistical evidence of a difference between the two population proportions at the significance level of 0.05 ?
| A. No, because the probability of observing a difference at least as large as the sample difference, if the two population proportions are the same, is greater than 0.05. | |
| B. No, because the probability of observing a difference at least as large as the sample difference is less than 0.05. | |
| C. Yes, because the probability of observing a difference at least as large as the sample difference, if the two population proportions are the same, is less than 0.05. | |
| D. Yes, because the probability of observing a difference at least as large as the sample difference is greater than 0.05. | |
| E. Yes, because the sample proportions are different. |
Hint:
Identify the appropriate test and hypotheses, then conduct the test and compare its p-value to the given significance level α to evaluate the statistical evidence.
Explanation
To draw a conclusion about the given data, first identify the appropriate test and hypotheses. Then conduct the test and compare its p-value to the given significance level α.
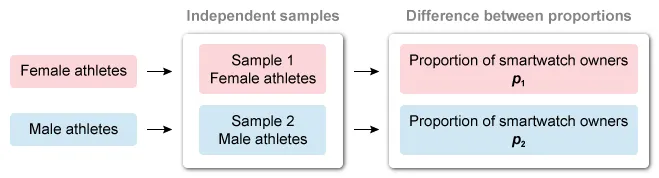
Researchers selected two independent random samples (female and male athletes) to determine whether there is a difference in the proportion of smartwatch owners between the populations.
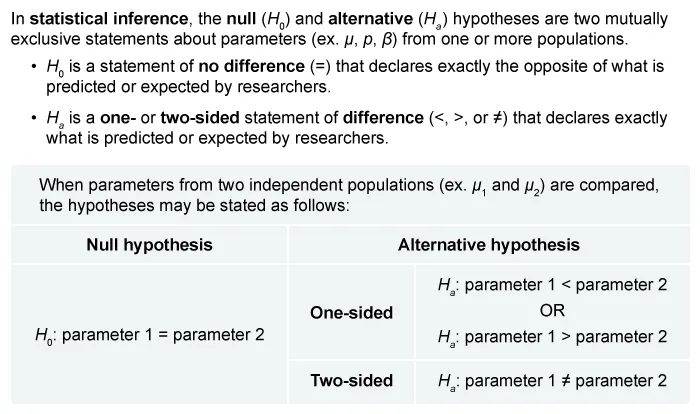
The appropriate hypothesis test must evaluate whether there is a difference between two population proportions, so the hypotheses are:
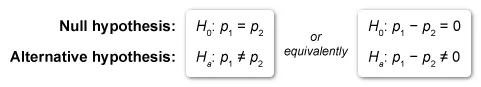
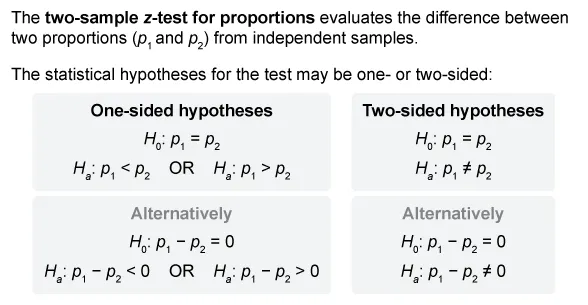
When conditions for inference are met, the hypothesis test that determines whether there is a difference between proportions from two independent samples is the two-sample z-test for proportions.
Notice that Ha is two-sided, so conduct a two-sided, two-sample z-test for proportions and calculate its p-value. Then compare the p-value to the significance level α.
| Locate the two-sample z-test for proportions (2-PropZTest) command on a calculator. Input the given values of the sample statistics for each sample (x1 = 180, n1 = 210, x2 = 261, and n2 = 290), and select the two-sided alternate hypothesis, Ha: p1 ≠ p2. |
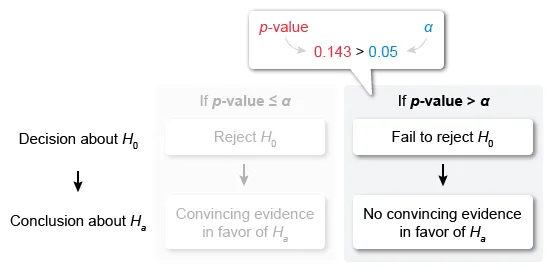
If the p-value ≤ α, there is convincing evidence that Ha is true (difference between proportions).
If the p-value > α, there is not convincing evidence that Ha is true (no difference between proportions).
The p-value is 0.143, which is greater than 0.05 (the given significance level α), so there is not convincing evidence in favor of Ha.
The p-value assumes H0 is true, so the p-value for the two-sample z-test for proportions assumes that the two population proportions are the same.
| Therefore, there is not convincing evidence because the probability of observing a difference at least as large as the sample difference, if the two population proportions are the same, is greater than 0.05. |
(Choices B, C, and D) The p-value is greater than (not less than) the given significance level (0.05), so there is no convincing statistical evidence to conclude that there is a difference between the population proportions.
(Choice E) An apparent difference between two sample proportions does not provide convincing statistical evidence of a difference. It is necessary to conduct a hypothesis test to evaluate the statistical evidence.
Things to remember:
- A two-sample z-test for the difference of proportions compares proportions of two independent samples.
- The p-value is the probability of finding the observed or more extreme results when the null hypothesis H0 is true. The definition of "extreme" depends on the direction specified by the alternative hypothesis Ha.
- To determine whether there is convincing statistical evidence against a null hypothesis H0 and in favor of an alternative hypothesis Ha, compare the p-value to the significance level α.
- If p-value ≤ α, there is convincing evidence in favor of Ha.
- If p-value > α, there is not convincing evidence in favor of Ha.

UWorld’s service is pretty good and helps provide a lot of explanations on subjects I haven’t been confident on before.
The questions here are the most realistic to the AP tests I've seen so far! I appreciate the ability to customize tests as well.
The best part is that all options are well-explained, telling clearly why they are not the right option.