


Question
In a simulated game, the roll of a fair six-sided die is randomized according to a computer. The computer software was written to guarantee that rolls are independent and that the probability of the number 2 landing faceup is equal to . If the computer software is functioning correctly, which of the following statements must be true?
-
In repeated simulations, the relative frequency with which the number 2 will land faceup in the long run is equal to .
-
If after several repetitions the relative frequency of the number 2 landing faceup is less than , then the probability that the number 2 lands faceup will increase for future simulations.
-
The relative frequency will equal the probability if the number of simulations is greater than 30.
| A. I only | |
| B. II only | |
| C. I and II only | |
| D. I and III only | |
| E. I, II, and III |
Hint:
Probability is the relative frequency of an outcome of a chance process in the long run.
Explanation
A probability is the relative frequency of an outcome of a chance process when the process is repeated many times (long-run frequency).
The law of large numbers states that as the number of independent trials of a chance process increases, the observed relative frequency of an outcome gets closer to its expected relative frequency (probability).
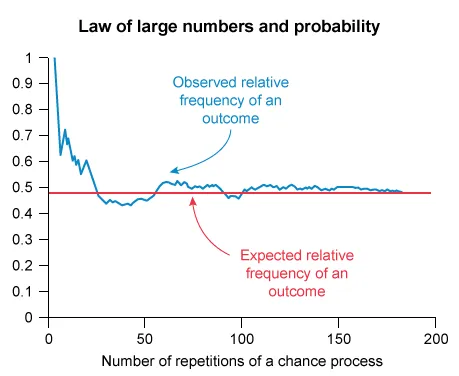
When the number of trials is small, the relative frequency may differ from the true expected relative frequency due to random variation. Determine whether each statement is true.
Statement I: In repeated simulations, the relative frequency with which the number 2 will land faceup in the long run is equal to .
If the computer software is functioning correctly, the probability that the number on the fair six-sided die that lands faceup is 2 is equal to .
This statement is true because the law of large numbers guarantees that the probability of an event is equal to the expected long-run frequency of that event. It is possible to eliminate Choice B.
Statement II: If after several repetitions the relative frequency of the number 2 landing faceup is less than , then the probability that the number 2 lands faceup will increase for future simulations.
If the computer software is functioning correctly, then the simulated rolls are independent. Events are independent if the occurrence of one event does not impact the probability of the other.
This statement is false because the probability (likelihood) that the number 2 lands faceup is not impacted by earlier rolls of the die. It is possible to eliminate Choices B, C, and E.
Statement III: The relative frequency will equal the probability if the number of simulations is greater than 30.
The law of large numbers guarantees that the relative frequency will approach the true probability as the number of repetitions increases, but it may or may not be exactly equal to the probability.
This statement is false because it is not certain that the observed relative frequency of the number 2 will be equal to the true probability, for any number of simulations. It is possible to eliminate Choices D and E.
Therefore, only Statement I must be true.
Things to remember:
A probability is the relative frequency of an outcome of a chance process when the process is repeated many times (long-run frequency).
The law of large numbers states that as the number of independent trials of a chance process increases, the observed relative frequency of an outcome gets closer to its expected relative frequency (probability).
Question
Which of the following graphs represents a binomial probability distribution with parameters n = 16 and p = 0.50 ?
A.  |
|
B. 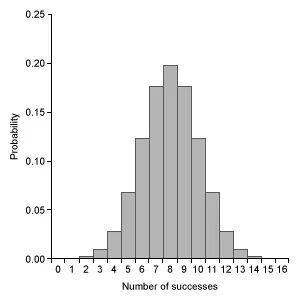 |
|
C. 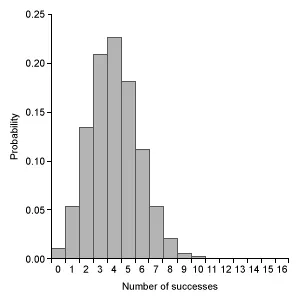 |
|
D. |
|
E. 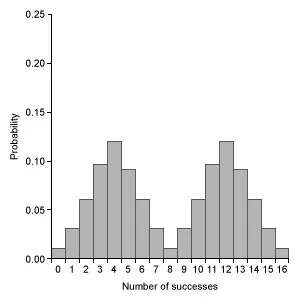 |
Hint:
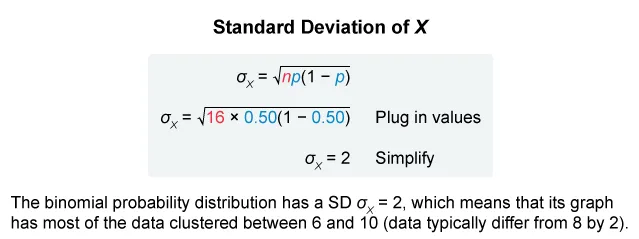
Consider the mean and standard deviation of the binomial distribution: μx = np and .
Explanation
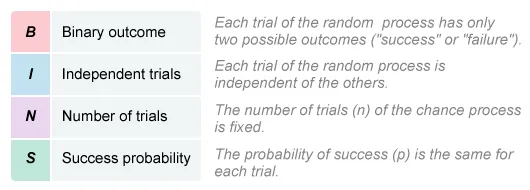
A binomial probability distribution models the probability of the number of successes of a binomial random variable that meets the conditions of a binomial setting (BINS).
When the parameters of a binomial distribution meet certain conditions, the normal distribution can approximate a binomial distribution.
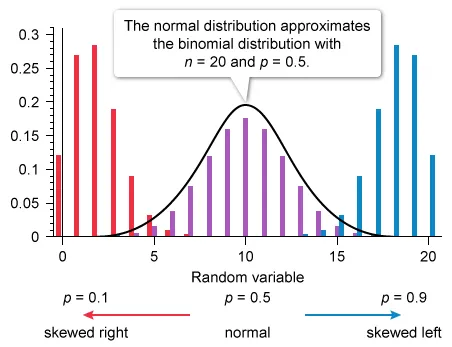
Eliminate Choice A because a binomial distribution with probability of success p = 0.5 is approximated by a normal distribution. Eliminate Choice E because binomial distributions cannot be bimodal.
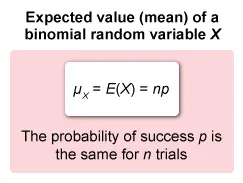
Notice that the remaining graphs each have a different center, so calculate the mean μx of a binomial distribution with n = 16 and p = 0.5 (μx = np).
| μx = np | Mean of binomial variable X |
| μx = 16 × 0.50 | Plug in values |
| μx = 8 | Simplify |
The mean μx of the given distribution is 8. The graph in Choice B is the only distribution with a single peak at 8.
Note: It is also possible to calculate the standard deviation of the distribution to help identify the correct graph.
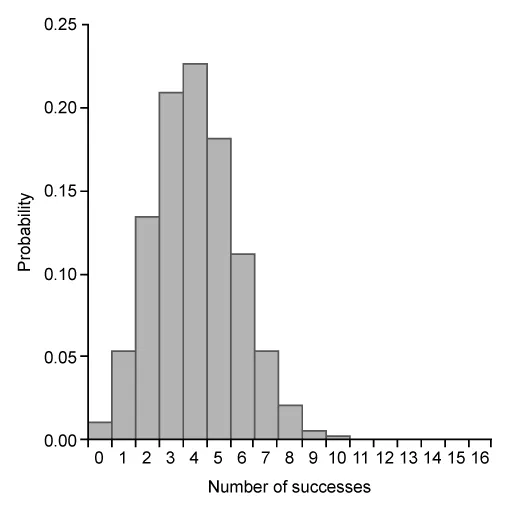
(Choices A and E) The binomial distribution with n = 16 and p = 0.50 is approximated by a normal distribution, but Choice A is a geometric distribution and Choice E is bimodal.
(Choice C) This graph is slightly skewed to the right and centered at 4, but the graph of a binomial distribution with n = 16 and p = 0.50 is approximately normal and centered at 8.
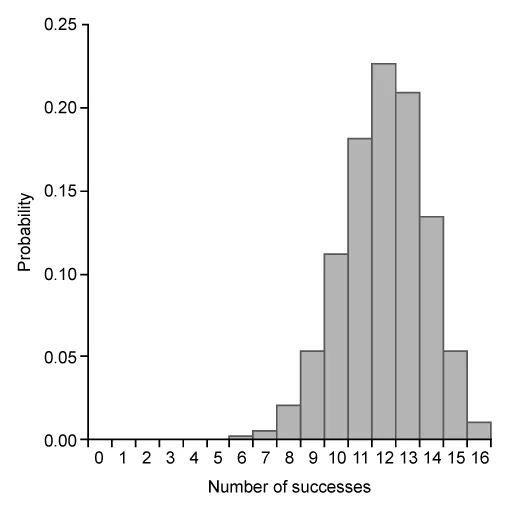
(Choice D) This graph is slightly skewed to the left and centered at 12, but the graph of a binomial distribution with n = 16 and p = 0.50 is approximately normal and centered at 8.
Things to remember:
- The binomial distribution with parameters n and p has mean (expected value) μx = np and standard deviation
- When p = 0.5, the binomial distribution is approximated by the normal distribution.
Question
A cereal company launches a superhero promotion and decides to include 1 of 5 different superhero figurines in each box of their kids' cereal. The company states that each of the 5 figurines is equally likely to appear in any box of cereal. A statistics student decides to run a simulation to investigate how many boxes of cereal it would take to collect all of the figurines. One trial of the simulation is described by the following steps.
Step 1: Label 5 different tokens 1 through 5 and assign each number to represent a different figurine.
Step 2: Randomly select 1 token at a time with replacement until the 5 different numbers are collected.
Step 3: Record the number of tokens necessary to collect the 5 different tokens.
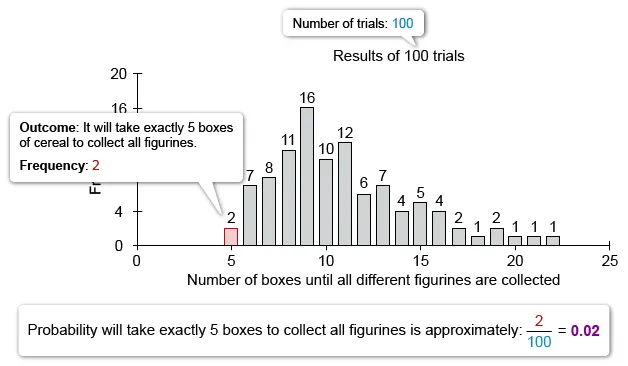
The results of 100 trials of the simulation are shown in the following histogram.
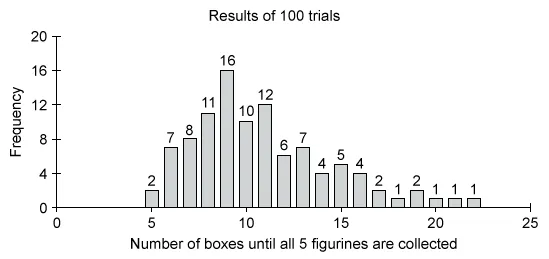
Based on the results of the simulation, which of the following statements is true?
| A. The simulation suggests that the approximate probability that it will take exactly 5 boxes of cereal to collect all 5 figurines is greater than the probability that it will take more than 20 boxes of cereal. | |
| B. The simulation suggests that the probability that it will take less than 10 boxes of cereal to collect all 5 figurines is about 0.55. | |
| C. The simulation suggests that it will take more than 18 boxes of cereal to collect all 5 figurines approximately 5% of the time. | |
| D. The simulation suggests that it will take more than 19 boxes of cereal to collect all 5 figurines approximately 95% of the time. | |
| E. The simulation suggests that it will take at least 22 boxes of cereal to collect all 5 figurines. |
Hint:
To find the relative frequency of a particular outcome in a simulated random process, identify the frequency (count) of the outcome of interest and divide that value by the total number of trials in the simulation.
Explanation
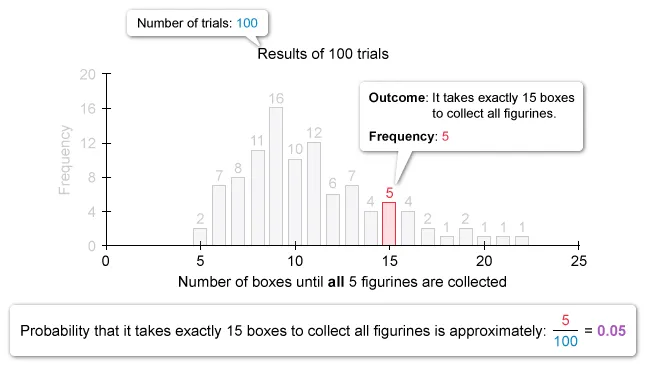
Simulation is the repetition of a random process that closely matches a real-world random event. In a simulation, the relative frequency of each outcome in a random process approximates its probability.
To find the relative frequency of a particular outcome in a simulated random process, identify the frequency (count) of the outcome of interest and divide by the total number of trials in the simulation (ex. 100).
Use the given simulation to analyze each answer choice and determine which statement is true. Notice that it takes more than 18 (19 or more) boxes of cereal to collect 5 different figurines in 5 out of 100 trials.

Therefore, the statement that is true is:
| The simulation suggests that it will take more than 18 boxes of cereal to collect all 5 figurines approximately 5% of the time. |
(Choice A) The approximate probability that it will take exactly 5 boxes to collect all 5 figurines is 0.02, which is equal to (not greater than) the approximate probability that it will take more than 20 boxes (also 0.02).
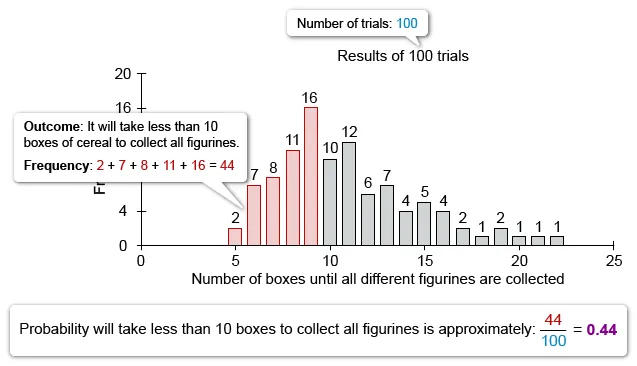
(Choice B) Based on the simulation, the probability that it will take less than 10 boxes to collect all 5 figurines is 0.44, not 0.55.
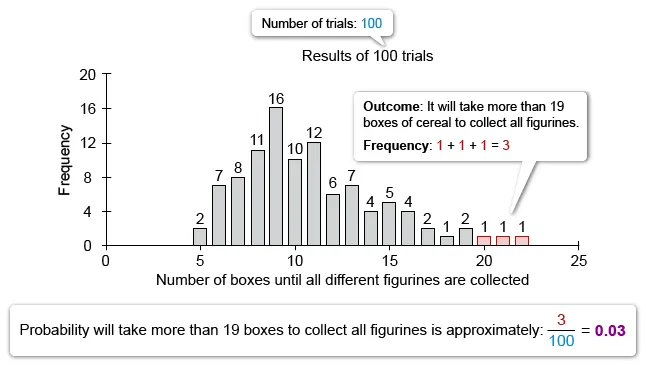
(Choice D) Based on the simulation, the probability that it will take more than 19 (20 or more) boxes to collect all 5 figurines is 3%, not 95%.
(Choice E) The simulation includes trials where the number of boxes required to collect all 5 figurines was less than 22, so it does not suggest that there must be at least 22 boxes of cereal to collect all 5 figurines.
Things to remember:
- Simulation is the repetition of a random process that closely matches a real-world random event. In a simulation, the relative frequency of each outcome approximates its probability.
- The relative frequency of a particular outcome in a simulated random process is equal to its frequency (count) divided by the total number of trials in the simulation.

UWorld’s service is pretty good and helps provide a lot of explanations on subjects I haven’t been confident on before.
The questions here are the most realistic to the AP tests I've seen so far! I appreciate the ability to customize tests as well.
The best part is that all options are well-explained, telling clearly why they are not the right option.