AP® Statistics Unit 3 Review and Practice Test
Be ready to learn planning, conducting, and interpreting data collection with UWorld’s comprehensive AP® Statistics Unit 3 review. By mastering sampling methods, survey design, and producing unbiased, valid results, you’ll gain confidence and clarity to answer AP Stats Unit 3 FRQs. Our all-in-one prep solution brings engaging videos, interactive study guides, and realistic AP-style practice tests, so you ace the unit and get closer to scoring 5.
Score High by Building Exam-Readiness with Our AP Stats Unit 3 Review
UWorld’s AP Statistics Unit 3 resources don’t just prepare you for the exam, but give you clarity beyond the unit to develop critical thinking and problem-solving across units. With in-depth explanations, practice tests, and engaging videos in an integrated platform, your prep gets a substantial boost.
Sampling Made Easier
Learn sampling methods, survey design, and experimental control with our dynamic video library, which makes statistics come alive. Each video is accompanied by step-by-step explanations and real AP-style examples, making complex concepts easier to learn and memorable.
Guide That Makes It Count
Don’t worry about reading dense textbooks when you can learn from visual explanations, applied examples, and clear summaries. Our expertly written interactive study guide prepares for the exam day with clarity and confidence to analyze every data collection scenario.
Test Yourself With Questions You’ll Encounter in the Exam
Question
An investigator conducted a study to determine the effects of a new hair-growth shampoo for women with thinning hair. A total of 50 women with thinning hair volunteered to participate in the study. The women were randomly assigned to either the new shampoo or regular shampoo. At the end of a 12-week period, the change in hair length for each woman was recorded. The women in the group using the new shampoo had, on average, a greater change in hair length than the women in the group using regular shampoo. Which of the following is the most appropriate conclusion?
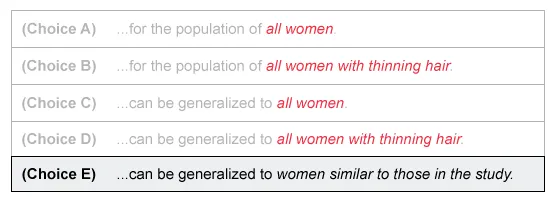
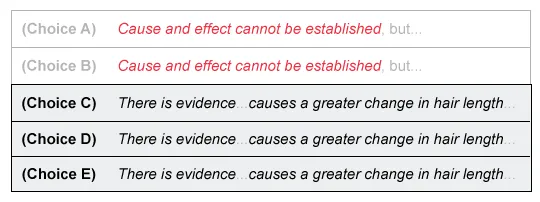
| A. Cause and effect cannot be established, but there is an association between using the new shampoo and a greater change in hair length for the population of all women. | |
| B. Cause and effect cannot be established, but there is an association between using the new shampoo and a greater change in hair length for the population of all women with thinning hair. | |
| C. There is evidence that using the new shampoo causes a greater change in hair length than using regular shampoo, and the conclusion can be generalized to all women. | |
| D. There is evidence that using the new shampoo causes a greater change in hair length than using regular shampoo, and the conclusion can be generalized to all women with thinning hair. | |
| E. There is evidence that using the new shampoo causes a greater change in hair length than using regular shampoo, and the conclusion can be generalized to women similar to those in the study. |
Hint:
To generalize results to a population, study participants must be randomly selected from that population.
To establish a cause-and-effect relationship, study participants must be randomly assigned to treatments.
Explanation
In statistical inference, the purpose is to make inferences about a population or about cause-and-effect relationships.
To generalize results to a population, study participants must be randomly selected from that population.
To establish a cause-and-effect relationship, study participants must be randomly assigned to treatments.
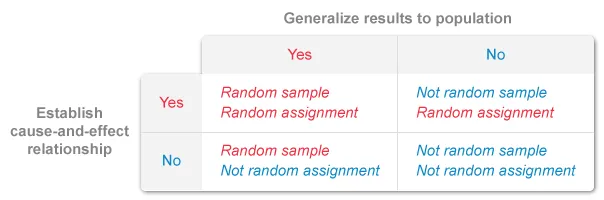
Determine whether results generalize to a larger population (random sample) and whether it is possible to establish a cause-and-effect relationship (random assignment).
Note: If the sample was randomly selected, identify the population from which it was chosen.
Generalize results to a population:
It is given that women volunteered to participate in the study, so women were not randomly selected, and results do not generalize to any other population of women not similar to those in the study.
It is possible to eliminate Choices A, B, C, and D because they generalize to populations larger than women in the study (all women and all women with thinning hair).
Establish a cause-and-effect relationship:
It is given that women were randomly assigned to shampoos (treatments), so the results of the study are evidence of cause and effect between the type of shampoo and change in hair length.
It is possible to eliminate Choices A and B because they state that cause and effect cannot be established.
By a process of elimination, there is evidence that using the new shampoo causes a greater change in hair length than using regular shampoo, and the conclusion can be generalized to women similar to those in the study.
Things to remember:
-
If study participants are randomly chosen, results generalize to the population from where they were selected. Otherwise, results generalize to the sample under study and similar individuals.
-
If study participants are randomly assigned to treatments, results are evidence of a cause-and-effect relationship. Otherwise, results are evidence of statistical association.
Question
A psychologist is interested in the development of figure-ground color perception in infants. She randomly selected 6 five-month-old infants, 6 seven-month-old infants, 6 nine-month-old infants, and 6 eleven-month-old infants. The psychologist then measured the ability of the infants to detect colored objects on checkered backgrounds. Which of the following best describes the psychologist's sampling method?
| A. A cluster random sample | |
| B. A simple random sample | |
| C. A stratified random sample | |
| D.A systematic random sample | |
| E. A volunteer sample |
Hint:
To identify the sampling method in a study, evaluate whether random selection is used and whether individuals are selected directly from the population or from groups within the population.
Explanation
To identify the sampling method in a study, determine whether the selection of individuals is random or nonrandom, and if individuals are selected from directly from a population or from groups within a population.
It is given that the psychologist randomly selected infants from 4 groups of infants of different ages, so the population was divided by age and then independent random samples were taken from each age group.
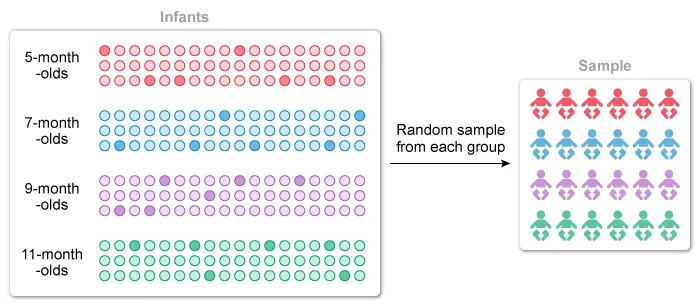
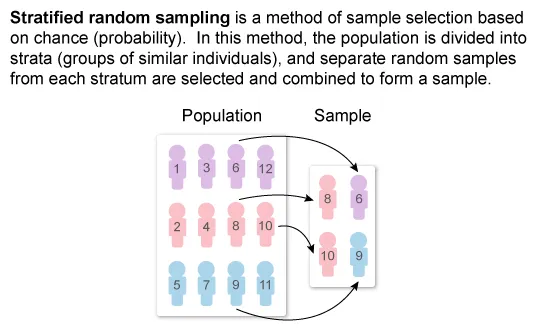
This method of sampling is known as stratified random sampling, where the population is divided into groups (strata) and independent random samples from each group (stratum) are selected and combined to form a sample.
Therefore, the psychologist's sampling method is best described as a stratified random sample.
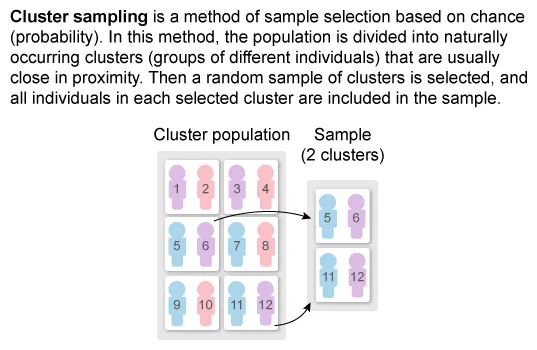
(Choice A) In a cluster random sample, the population is divided into smaller similar groups (clusters), and data from all individuals in randomly selected clusters are used. However, the psychologist randomly selected children within every age group (strata), rather than selecting all individuals in a sample of groups.
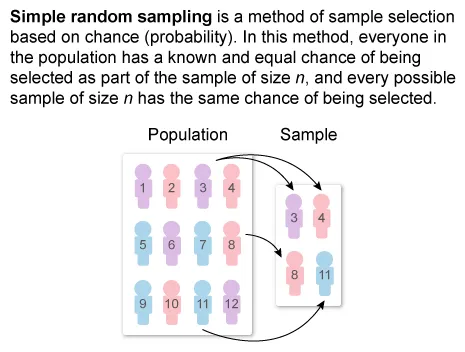
(Choice B) For a simple random sample, individuals are selected directly from the population to form the sample. However, the psychologist did not randomly select 24 infants from the population of infants, but instead randomly selected six infants from each of the four age groups (strata).
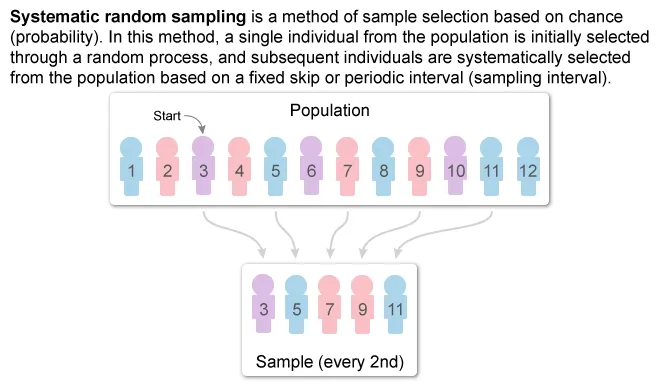
(Choice D) In a systematic random sample, a random member from the population is selected and subsequent individuals are selected based on fixed or periodic intervals.
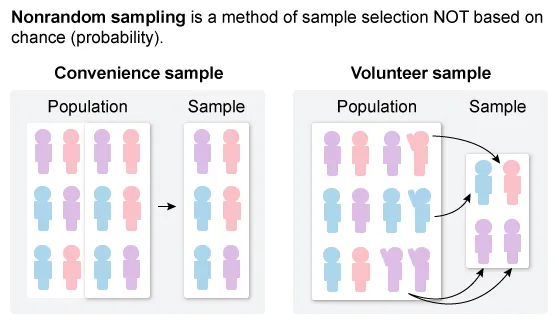
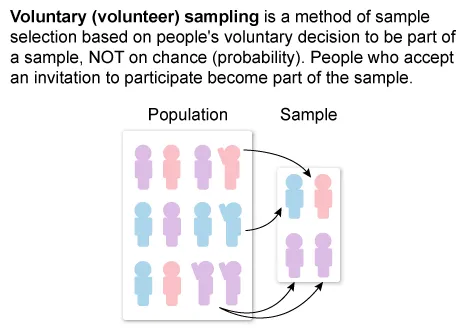
(Choice E) A volunteer sample is an example of nonrandom sampling methods. However, the psychologist used a random sampling method.
Things to remember:
In stratified random sampling, the population of interest is divided into different strata based on a common characteristic, and a simple random sample is then chosen from each stratum and combined to form a sample.
Question
A researcher wants to conduct a study to compare the effect of using nicotine patches, nicotine gums, and a multi-faceted approach that may include counseling, support groups, and behavioral therapy to help adults quit smoking. He is concerned that the effects of these approaches vary depending on the number of packs of cigarettes smoked per day. Which of the following research designs would be most appropriate to address the researcher's concern?
| A. A completely randomized design | |
| B. A double-blind experimental design | |
| C. A matched-pairs design | |
| D. A single-blind experimental design | |
| E. A randomized complete block design |
Hint:
Consider that there are three variables of interest: the treatments, the response, and a third variable that the researcher is concerned about.
Explanation
It is given that a researcher is concerned that the effect of three nicotine treatments (patches, gums, and multi-faceted approach) on quitting smoking varies depending on the number of packs of cigarettes smoked per day.
There are three variables of interest: the three treatments, the response, and a third variable that the researcher is concerned about.
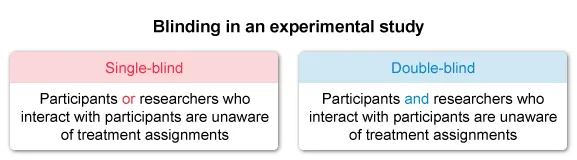
Consider that blinding helps prevent bias but will not help control for differences in the effect of the nicotine treatments based on the number of packs of cigarettes smoked. Eliminate Choices B and D.
To determine which research design would be most appropriate to address the researcher's concern, consider how many variables are accounted for in each of the most common experimental designs.
Notice that the study compares three treatments, so eliminate Choice C.
To account for the effect the number of packs of cigarettes smoked per day has on the treatments, it is necessary to group subjects based on number of packs smoked per day and then evaluate each group separately.
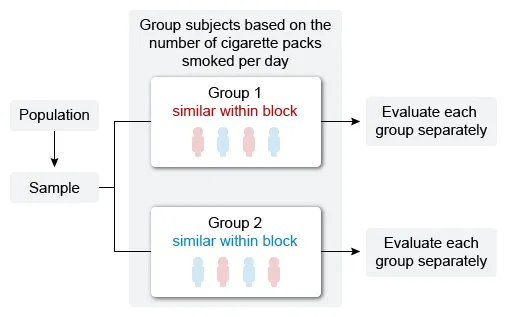
This research design would control how the effects of the treatments vary depending on the number of packs of cigarettes smoked per day.
Therefore, the research design that would be most appropriate to address the researcher's concern is the randomized complete block design.
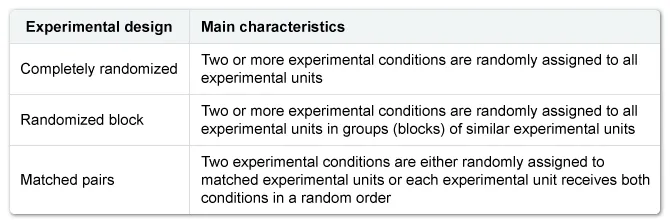
(Choice A) A completely randomized design can compare the effect of the treatments on the response (quitting smoking), but will not account for the number of cigarettes smoked per day (the researcher's concern).
(Choices B and D) Blinding controls bias but does not help evaluate the effect of different treatments.
(Choice C) A matched-pairs design can help control for differences in the effect of the treatments due to the number of packs of cigarettes smoked per day if there are two treatments. However, the study has three treatments.
Things to remember:
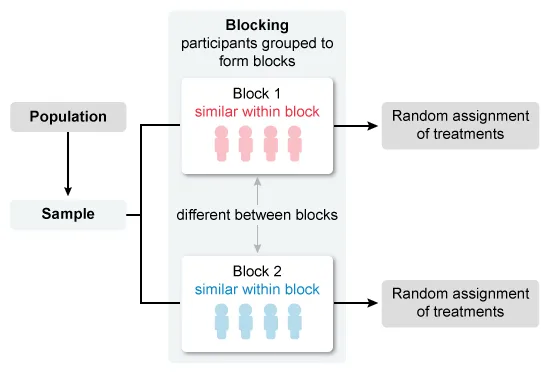
A randomized complete block design allows the evaluation of treatment effects in groups (blocks) of similar individuals (experimental units). It is the most appropriate design when the effect of treatments varies based on another variable.
Study At Your Fingertips
Turn idle time into progress by reviewing key formulas on the bus, rewatching videos before class, and solving quick AP Statistics Unit 3 practice questions between study sessions. The UWorld app is your one-stop solution across all devices, so your effort isn’t wasted. Stay confident and consistent for anything that comes your way.
Stand Out
with a Top Score on the AP Statistics Exam
Finish your AP Statistics Unit 3 review and continue mastering all units with UWorld. Complete our AP Statistics full review course to boost your performance and stand out as a top candidate for competitive colleges, majors, and scholarships by earning a top score.
Get our all-in-one course today!
- Focused AP Stats Videos
- Print & Digital Study Guide
- 1300+ Exam-style Practice Questions
- Customizable Quiz Generator
- Adjustable Study Planner
- Realistic Timed Test Simulation
- Colorful Visual Explanations
- Progress Dashboard
- Smart Flashcards & Digital Notebook
Hear From Our AP Statistics Students
UWorld’s service is pretty good and helps provide a lot of explanations on subjects I haven’t been confident on before.
The questions here are the most realistic to the AP tests I've seen so far! I appreciate the ability to customize tests as well.
The best part is that all options are well-explained, telling clearly why they are not the right option.
Frequently Asked Questions (FAQs)
What are the main topics covered in AP Statistics Unit 3: Collecting Data?
AP Statistics Unit 3: Collecting Data teaches how to design surveys and experiments that yield reliable and unbiased results. You’ll learn about random sampling, bias, and how to design experiments and surveys that lead to valid conclusions. It might sound technical, but this unit is all about ensuring data is trustworthy, which is something the AP Statistics exam frequently tests.
The key concepts include:
- Planning a study
- Sampling methods
- Sources of bias in sampling methods
- Designing an experiment
- Interpreting the results of an experiment
This unit also emphasizes the importance of data ethics and transparency in drawing conclusions. Mastering these ideas prepares you for both MCQ and FRQ questions in the AP Stats Unit 3 progress checks. If you’re reviewing for the AP Statistics Unit 3 test, focus on how data collection choices affect what you can conclude from results. By the end, you’ll know how to plan data collection that truly represents a population, an essential skill for later topics like inference, regression, and probability.
UWorld’s AP Statistics Unit 3 review explains these topics using simple examples and step-by-step reasoning, helping you connect what you learn to the kinds of questions the College Board asks. Once you understand how data is collected, everything that follows in statistics, including inference, probability, and regression, becomes much more comprehensible.
How should I prepare for an AP Statistics Unit 3 exam?
The best way to prepare for the AP Statistics Unit 3 test is to study actively rather than just reading notes. This unit covers how data are collected, sampled, and analyzed, and understanding the reasoning behind each method is key. You’ll score higher when you can explain why a study design works, not just define it.
A strong prep plan might look like this:
- Watch short video lessons that explain bias, random sampling, and random assignment.
- Write short summaries after each lesson instead of passively reading.
- Practice AP Stats Unit 3 MCQs and FRQs regularly under timed conditions.
- Review explanations carefully, both correct and incorrect answers teach you how exam logic works.
- Simulate full-length AP Statistics Unit 3 practice tests to build endurance.
Consistent practice helps you recognize patterns in how data-collection questions are asked. Use UWorld’s AP Statistics Unit 3 review tools to bridge the concept and application, from interactive guides to realistic tests. You’re ready for the real exam when you can explain why a sample is valid or why a design is biased. The more you practice reasoning through study design and sampling, the more comfortable you’ll be when the exam asks you to explain why a sample is valid or a method is biased. Consistent practice transforms memorization into intuition, and that’s how you master Unit 3.
Are any free resources available for AP Statistics Unit 3?
Yes. UWorld offers a 7-day free trial that gives you full access to AP Statistics Unit 3: Collecting Data lessons, sample videos, and interactive practice questions. It’s a great way to experience how our platform teaches sampling, randomization, and survey design using real AP-level examples. After going through video lessons on sampling methods and bias, reviewing study guide excerpts, and answering progress check questions, you’ll be ready to take practice tests that cover detailed explanations behind every correct answer.
During the free trial, you can explore:
- Video lessons that break down randomization and bias step by step.
- Interactive questions modeled after real AP Stats Unit 3 FRQs and MCQs.
- Study guide excerpts and practice explanations for deeper understanding.
The trial gives you hands-on exposure to AP-style problem-solving without risk or cost. Once you upgrade, you’ll have access to practice questions, digital and print study materials, and a comprehensive QBank covering all AP Statistics units. The free trial is the ideal starting point for students exploring types of samples in AP Stats or needing practice with systematic sampling.
You’ll see how data collection logic plays out in real question formats, which improves your reasoning skills before you ever take a full test. Alongside UWorld, you can also explore official College Board progress checks and Khan Academy videos for extra practice. Together, they create a powerful blend of structure, clarity, and repetition that builds exam confidence quickly.
What types of questions are on the AP Stats Unit 3 test?
The AP Statistics Unit 3 test combines multiple-choice (MCQs) and free-response questions (FRQs) that focus on sampling, experimentation, and bias. Instead of asking you to memorize terms, the exam tests whether you can apply statistical reasoning to real-world studies.
Typical question formats include:
- Identifying the correct sampling method used in a scenario.
- Spotting sources of bias or confounding variables.
- Interpreting an experimental design diagram.
- Explaining how randomization improves validity.
FRQs often ask you to design an experiment or critique one, while MCQs test your ability to interpret short scenarios quickly. For example, can you distinguish between cluster sampling and stratified sampling, or identify why a study is not randomized? You’ll learn the AP examiner’s phrasing and logic through repeated practice with Unit 3 progress check MCQs and FRQ examples.
UWorld’s AP Statistics Unit 3 review breaks down these question types using authentic exam phrasing and logic. You’ll practice not just answering but thinking like the test writer, about why a study works, what makes it fair, and what could go wrong. By studying this way, you’ll recognize familiar question patterns, reduce guesswork, and go into the exam confident about how each question connects to the “collecting data” core of statistics.
How can I improve my score on the FRQs and MCQs for Unit 3?
To raise your score on AP Statistics Unit 3 FRQs and MCQs, focus on understanding why sampling or experimental designs work instead of memorizing rules. Scorers reward logical reasoning and precise vocabulary, not rote definitions.
For FRQs, write answers that explain your thinking step-by-step, state the method, justify it, and connect it to data validity. For MCQs, practice identifying what’s wrong with a flawed survey or biased design. The fastest way to improve is to analyze your mistakes deeply. UWorld’s AP Stats Unit 3 FRQ and MCQ sets give detailed rationales that explain why each incorrect option fails, which helps you avoid repeating errors. Here’s how to structure your daily prep:
- Master key vocabulary
- Use detailed rationales
- Review Unit 3 video lessons and apply them through practice.
- Use timed drills to build accuracy under pressure.
Consistent, feedback-based practice improves pattern recognition and builds exam instincts. Over time, you’ll not only recall sampling methods but think like a test maker, evaluating whether a study’s logic holds up. That’s the mindset that turns average scores into 5s.
What is the "Collecting Data" unit's weight on the AP Statistics exam?
The AP Statistics Unit 3: Collecting Data typically accounts for about 12–15% of your overall exam score, but its importance goes far beyond that. Though introduced early in the course, Unit 3 forms the intellectual backbone of everything that follows in AP Statistics. Data collection logic, how samples are drawn, how bias is minimized, and how experiments are structured, underpins nearly every statistical conclusion you’ll make later.
Understanding this unit means you can describe sampling methods and experimental designs and recognize when a study’s setup leads to flawed or misleading results. The design principles you master here reappear constantly in later units, especially in inference, regression, and hypothesis testing. Many FRQs on the AP Stats exam draw from scenarios built on these foundational ideas, often testing your ability to evaluate whether a study’s design supports valid conclusions.
UWorld’s AP Statistics Unit 3 review reinforces this connection by linking sampling and experimental design to real AP-style reasoning questions. Once you understand how random sampling and bias control influence validity, you’ll see why this unit is the backbone of the course. Investing time here pays off double, first in the 12–15% direct score weight, and again in every data interpretation question that builds on it.
Where can I find a good study guide for AP Statistics Unit 3?
A strong AP Statistics Unit 3 study guide should help you visualize the logic behind data collection, sampling, and experimental design. The best resources simplify complex ideas while showing how they appear in real AP exam questions. UWorld’s interactive AP Statistics study guide achieves this by blending clear explanations, diagrams, and embedded practice to ensure long-term retention. It’s designed for students who want to understand the theory and apply it correctly during the Unit 3 progress check, MCQs, and FRQs.
Here’s what a high-quality Unit 3 study guide should include:
- Comprehensive coverage of the unit
- Visual breakdowns of bias types and experimental controls
- Real-world examples that connect statistical design to practical decision-making
- Common error callouts to prevent conceptual traps in survey design
- Integrated practice questions after every subtopic for reinforcement
- Clear summaries of every subtopic in Unit 3
A great guide transforms passive review into active comprehension. UWorld’s AP Stats Unit 3 study guide integrates these elements through interactive explanations and applied examples. It’s designed for students who want clarity, not confusion, as each topic builds logically on the previous one. By pairing the guide with UWorld’s QBank and video lessons, you’ll not only remember definitions but actually understand how to use them. That’s the kind of confidence that carries through the entire AP Statistics exam.
Can I find practice tests specifically for AP Stats Unit 3?
Yes. You can find dedicated AP Statistics Unit 3 practice tests within UWorld’s QBank, designed to mimic the exact format and rigor of the official AP exam. These targeted tests focus solely on Collecting Data, allowing you to apply what you’ve learned about sampling, bias, and experimental design in realistic scenarios. Each question is modeled after AP-style prompts, complete with detailed explanations that dissect why an answer is correct and the others are wrong.
You’ll practice distinguishing between sampling types, evaluating survey flaws, and explaining why a study is or isn’t randomized. Regularly using AP Stats Unit 3 practice tests builds speed, precision, and confidence. UWorld’s analytics even help you track which subtopics, such as random assignment or sampling bias, require extra review. Practicing this way ensures you walk into the test knowing what to expect, how to interpret every design question, and how to explain your reasoning clearly.
How does AP Statistics Unit 3 connect to the other units?
AP Statistics Unit 3: Collecting Data isn’t just one chapter, but the foundation of the entire course. Every later unit, from probability to inference and regression, depends on the quality of the data you collect here. Understanding how to design unbiased samples and conduct valid experiments determines whether future analyses are meaningful or flawed.
Think of the course as a chain reaction:
- Unit 3 teaches how to gather fair and representative data.
- Units 4-7 teach you how to analyze and draw conclusions from it.
- The exam connects both. So, remember that if your data collection logic is weak, your statistical reasoning loses credibility.
Many AP Statistics FRQs mix Unit 3 and later topics, asking whether conclusions are valid based on the original design. That’s why mastering Unit 3 logic strengthens every other unit. UWorld’s AP Statistics Unit 3 review effectively integrates these connections by illustrating how poor sampling or bias can mislead even accurate calculations. When you understand why good data makes better inferences, the rest of the course becomes less intimidating. Unit 3 isn’t just worth 12–15% of the test; it’s what makes the remaining 85% possible to reason through correctly.
What are the most common mistakes students make in AP Statistics Unit 3?
Students often struggle in AP Statistics Unit 3 because they focus on memorizing definitions rather than understanding how the concepts interact. The most frequent mistake is confusing random sampling (used for generalization) with random assignment (used for causation). Knowing the difference is key to earning full credit on both MCQs and FRQs.
Other common errors include:
- Ignoring bias when evaluating survey questions.
- Using vague terms like “random” without explanation.
- Forgetting that larger samples don’t automatically fix poor design.
UWorld’s AP Stats Unit 3 review highlights these mistakes across hundreds of questions. By studying not just the correct answers but also the logic behind wrong ones, you’ll train yourself to think more critically. On the exam, graders reward reasoning. They’re looking for phrases like “this method reduces variability” or “random assignment controls confounding.” Avoid generic answers and explain the “why.” When your logic is precise, your score follows naturally.
What are some last-minute tips before the AP Statistics Unit 3 test?
The final days before your AP Statistics Unit 3 test are about sharpening recall and practicing clarity. You already know the material, and now you just need to apply it smoothly under pressure.
Here’s your quick action plan:
- Review your one-page summaries of sampling methods, bias types, and experiment principles.
- Revisit one UWorld AP Stats Unit 3 question set daily, as quality matters more than quantity.
- For FRQs, practice writing brief but structured responses using key terms like randomization, control, and replication.
- Prioritize rest and clear thinking, as mental sharpness beats cramming every time.
The night before, avoid learning new material. Instead, read through a few question explanations that previously confused you. Seeing how you’ve improved reinforces confidence. The exam tests reasoning, not memorization, so think in terms of cause and effect. If you can explain why a design is valid or a sample is biased, you’ve done your job. Walk into test day remembering that you’ve practiced smarter, not harder and your performance will show it.
What are the best tips for mastering sampling methods in AP Stats Unit 3?
Sampling methods can make or break your AP Statistics Unit 3 performance because they test whether you truly understand how to collect unbiased, representative data. Memorizing definitions won’t cut it as the exam expects you to explain why a method works and how it applies in real-world situations. The key to mastering this is active reasoning and repetition.
Start by building intuition, not lists:
- Compare real-life cases like political polls, school surveys, or product testing to the four main sampling types (simple random, stratified, cluster, and systematic).
- Create visual aids that map out how each design selects individuals differently.
- Explain out loud why one method is fairer or more efficient than another.
- Use UWorld’s AP Statistics Unit 3 sampling practice questions to test pattern recognition under exam-style conditions.
As you practice, focus on how randomness helps eliminate bias and how different methods serve different purposes. The exam will disguise sampling questions inside complex wording, so reading slowly and identifying the design logic is key. UWorld’s explanations train you to spot small details, phrases like “every fifth student” or “divided into groups” that hint at the correct method. When you can recognize and justify a sampling design instantly, you’ll be ready for even the trickiest Unit 3 questions. Understanding “why” turns sampling from memorization into mastery.
How can I identify and correct bias in AP Statistics Unit 3?
Bias is one of the most important concepts in AP Statistics Unit 3: Collecting Data, as it determines whether your conclusions are trustworthy. The AP exam often tests bias through real-world scenarios that seem realistic but hide subtle flaws in how the data were collected. Recognizing and fixing bias is what separates a good answer from an excellent one.
Here’s how to get there:
- Learn the three main types: sampling bias, response bias, and nonresponse bias, and what causes each.
- Practice explaining why each bias makes results invalid.
- Think like a researcher: ask whether everyone had an equal chance to participate, and whether the wording or setting might influence responses.
- Use UWorld’s AP Statistics Unit 3 practice sets to analyze how bias affects data interpretation, and how randomization and clear survey design can fix it.
When you read a question, train yourself to ask, “What part of this setup could make results unfair?” Once you can identify that weakness, articulate a solution, such as increasing randomness, revising questions, or improving participation rates. The College Board rewards answers that go beyond naming bias to explaining how to reduce it. With steady practice, you’ll start recognizing patterns immediately, and your explanations will sound precise, confident, and exam-ready.
How can I manage time effectively during the AP Stats Unit 3 practice exam?
Managing time during a practice exam for AP Statistics Unit 3 is where real test readiness develops. The goal isn’t just to finish quickly but to learn your natural pace and train your brain to think clearly under pressure. Treat every timed session as a dress rehearsal for the actual exam.
Here’s how to practice time control:
- Take one full-length Unit 3 practice test from UWorld’s AP Statistics question bank under exact AP conditions with no pauses, no distractions.
- Record how long each section takes, noting where hesitation happens.
- Analyze patterns, such as whether you are rereading too much and spending too long outlining. Missing points because of fatigue?
- After finishing, reattempt missed questions untimed to focus on reasoning without pressure.
The best students don’t just practice timing once, they adjust pacing week by week. That means balancing accuracy with awareness. As you progress, shorten your review windows and challenge yourself with slightly tighter deadlines. UWorld’s analytics dashboard helps you track completion time and accuracy together, which builds awareness of when to slow down or speed up. By test day, pacing will feel natural because you’ve rehearsed it. The result: calmer focus, fewer careless errors, and a confident finish across both multiple-choice and free-response sections.
Learn More About Specific Unit
Exploring One-Variable Data
Exploring Two-Variable Data
Probability, Random Variables, and Probability Distributions
Sampling Distributions
Inference for Categorical Data: Proportions
Inference for Quantitative Data: Means
Inference for Categorical Data: Chi-Square
Inference for Quantitative Data: Slopes


