


Question
Candy companies X, Y, and Z make boxes of gummies in five fruit flavors. Anna bought a box from each company and determined the number of gummies of each flavor. The graph below shows the relative frequency distribution of flavors for each box of gummies.
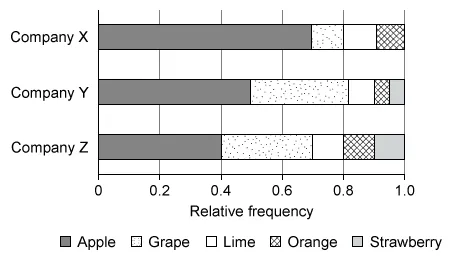
Which of the following statements must be true?
| A. The number of lime gummies in the Company X box was equal to the sum of the number of lime gummies in the other two boxes. | |
| B. There were fewer grape gummies in the Company X box than in the Company Y box. | |
| C. There were more apple gummies than grape gummies in the Company Y box. | |
| D. There were more grape gummies than apple gummies in the Company Z box. | |
| E. There was the same number of lime gummies in the Company Y box as in the Company Z box. |
Hint:
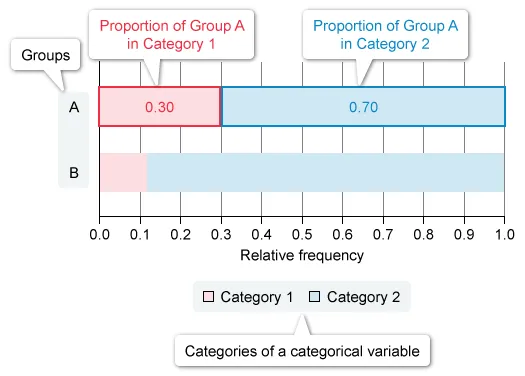
The width (or height) of segments in a segmented bar graph indicates either the relative frequency or counts of each category of a categorical variable.
Explanation
Each bar in a segmented bar graph represents a single group, and the width (or height) of the segments within each bar represents either the relative frequency or count of each category of a categorical variable in that group.
Note: A segmented bar graph of relative frequencies does not allow for a comparison of the number of observations per segment between groups unless the total number of observations in each group is given.
Analyze each answer choice to determine which of the statements is true, and recall that it is possible to compare only within the same box (because the total numbers of gummies in the boxes are not given).
Notice that in the Company Y box, the segment for apple gummies is larger than the segment for grape gummies.
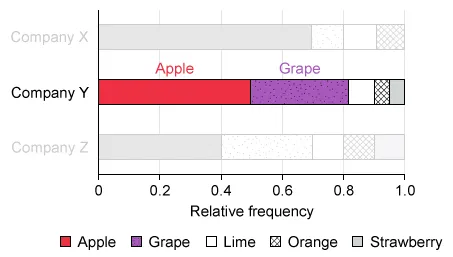
The relative frequency of apple gummies in the Company Y box is greater than grape gummies because the segment for apple gummies is longer than the segment for grape gummies (0.50 > 0.32).
Therefore, there were more apple gummies than grape gummies in the Company Y box.
(Choices A, B, and E) These statements are not true because the total number of gummies in each box is unknown and the given chart shows only relative frequencies (proportions). Therefore, it is impossible to compare the number of gummies of each flavor in different company boxes.
(Choice D) This statement is not true because the relative frequency of grape gummies in the Company Z box is approximately 0.3 and the relative frequency of apple gummies is 0.4.
Things to remember:
-
A segmented bar graph displays either the relative frequency or count distribution of a categorical variable in each of several groups.
-
A segmented bar graph of relative frequencies does not allow for a comparison of the number of observations per segment between groups unless the total number of observations in each group is given.
Question
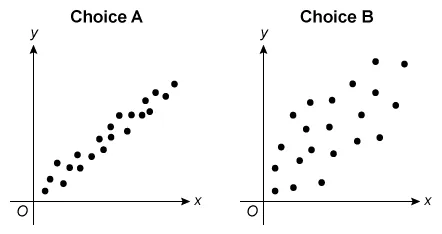
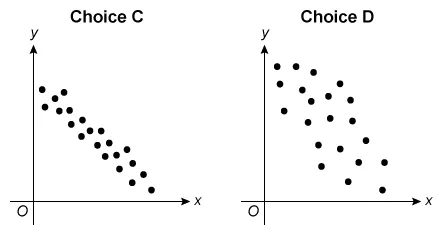
For which of the following scatterplots is the correlation between x and y closest to 0 ?
A. 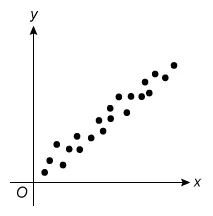 |
|
B. 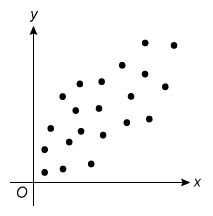 |
|
C. 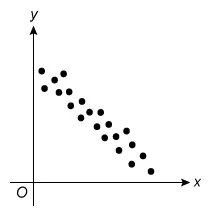 |
|
D.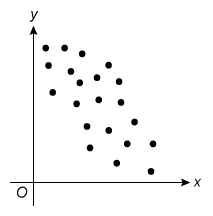
|
|
E. 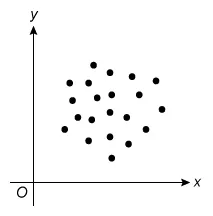
|
Hint:
The correlation coefficient describes the direction and strength of the relationship between two variables x and y.
Explanation
The correlation coefficient r describes the direction and strength of a linear relationship between two quantitative variables x and y. The magnitude of r indicates the strength of the relationship, and the sign of r indicates the direction.
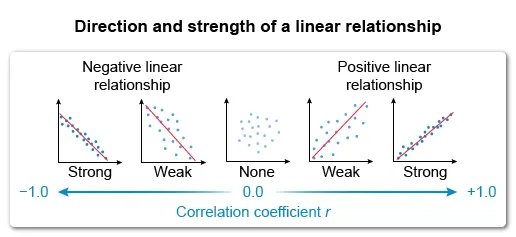
The question asks which scatterplot has a correlation closest to 0 (r = 0), which describes data with no linear relationship. Eliminate Choices A, B, C, and D because they show a linear relationship.
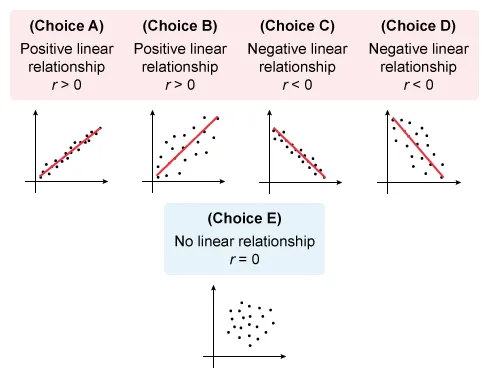
Of the choices, the scatterplot for which the correlation between x and y is closest to 0 is Choice E.
(Choices A and B)These scatterplots show different levels of strength of positive linear relationships (r > 0). However, the question asks for the plot with a correlation closest to 0 (r = 0).
(Choices C and D)These scatterplots show different levels of strength of negative linear relationships (r < 0). However, the question asks for the plot with a correlation closest to 0 (r = 0).
Things to remember:
- The correlation coefficient r describes the direction and strength of the relationship between two variables x and y.
- When two variables x and y do not show a linear relationship, the correlation coefficient r is equal to or close to 0.
Question
A pediatrician collected data on the age (in months) and length (in inches) of a random sample of boys between the ages of 1 and 12 months. A scatterplot of the data showed a strong linear relationship. The following regression was created:
length = 21.113 + 0.641(months)
The pediatrician uses the regression equation to predict the length of a 9-month-old boy and of an 18-month-old boy. Which of the following is a possible reason why the predicted length of the 9-month-old boy is more reliable than the predicted length of the 18-month-old boy?
| A. An age of 18 months is outside the interval of ages used to generate the regression equation. | |
| B. The age may not explain much of the variation in length. | |
| C. The correlation coefficient is positive. | |
| D. The slope of the sample regression line is greater than 0. | |
| D. The y-intercept of the sample regression is positive. |
Hint:
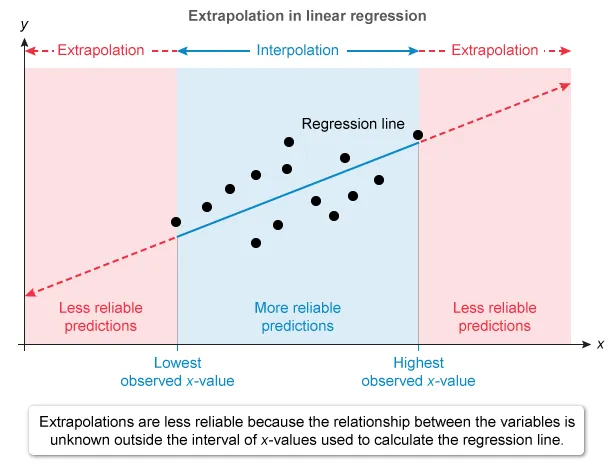
Extrapolation is the prediction of a response value for a value for the explanatory variable that is outside the interval of values used to determine the regression line.
Explanation
Extrapolation is the prediction of the value of the response variable y for a value for the explanatory variable x that is outside the interval of the x-values used to determine the regression line.
The predicted value is less reliable the further outside the x-values used to determine the regression line.
The regression predicts length (y) from the age (x) of boys aged 1 to 12 months, so the observed x-values range from 1 to 12 months. Unlike for a 9-month-old boy, the prediction for an 18-month-old is an extrapolation.
Therefore, the reason why the predicted length of the 9-month-old boy is more reliable than the predicted length of the 18-month-old boy is:
| An age of 18 months is outside the interval of ages used to generate the regression equation. |
(Choice B) The amount of variation in length explained by age describes how well the regression line fits the data, but it does not help to explain why a predicted value would be more precise than another.
(Choice C) A positive correlation coefficient indicates that as age increases, length tends to increase, but it does not help to explain why a predicted value would be more precise than another.
(Choices D and E) The slope and the y-intercept describe the regression line used to predict the length of boys from their age, but it does not help to explain why a predicted value would be more precise than another.
Things to remember:
-
Extrapolation is the prediction of the value of the response variable y for a value for the explanatory variable x that is outside the interval of x-values used to determine the regression line.
-
The predicted value is less reliable as an estimate the further the extrapolation.

UWorld’s service is pretty good and helps provide a lot of explanations on subjects I haven’t been confident on before.
The questions here are the most realistic to the AP tests I've seen so far! I appreciate the ability to customize tests as well.
The best part is that all options are well-explained, telling clearly why they are not the right option.