

Question
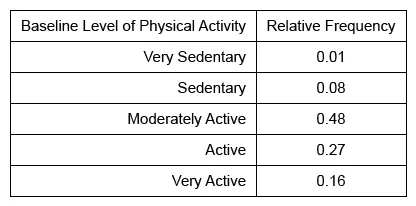
Arthur is the manager of a recently opened 24-hour gym. He wanted to know the baseline level of physical activity (PA) of new gym enrollees and decided to include a small survey in the enrollment application during a certain month. The survey asked individuals to rate their baseline level of PA as very sedentary, sedentary, moderately active, active, or very active. The relative frequency of each baseline level of PA of new enrollees who completed the survey is shown in the table below.
Which of the following statements must be true?
| A. Fewer new enrollees reported an active or very active rather than a moderately active baseline level of PA. | |
| B. More than half of the new enrollees reported having a moderately active baseline level of PA. | |
| C. Out of all new enrollees who completed the survey, 10 reported having a sedentary baseline level of PA. | |
| D. The number of new enrollees who reported having a very sedentary or sedentary baseline level of PA is 12. | |
| E. The proportion of new enrollees who reported having an active baseline level of PA is 0.91. |
Hint:
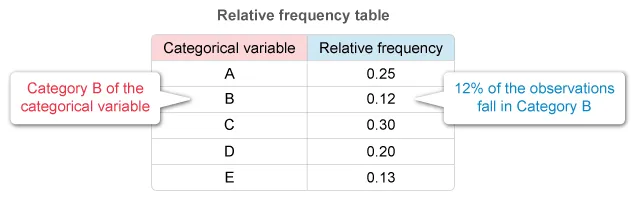
A relative frequency table gives the proportion of observations that fall into each category of a categorical variable.
Explanation
A relative frequency table gives the proportion of observations that fall into each category of a categorical variable.
The table of physical activity (PA) shows the proportion of the baseline levels of PA of new gym enrollees. Eliminate Choices C and D because the total number of enrollees is unknown and cannot be determined from the information given.
Notice that the proportion of new enrollees reporting a moderately active baseline PA level is 0.48 and that the proportion reporting an active or very active baseline PA level is 0.27 + 0.16 = 0.43.
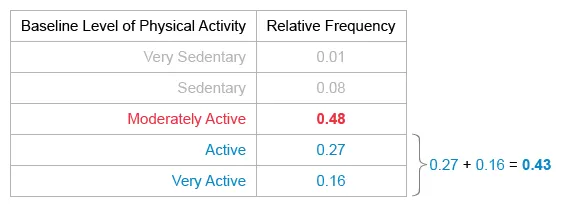
This finding means that the proportion of new enrollees reporting an active or very active baseline PA level (0.43) is less than the proportion reporting a moderately active baseline PA level (0.48).
Therefore, the statement that must be true is:
| Fewer new enrollees reported an active or very active rather than a moderately active baseline level of PA. |
(Choice B) The proportion of new enrollees who reported having a moderately active baseline level of PA (0.48) is less (not more) than half (0.50).
(Choices C and D) It is not possible to determine the number of new enrollees reporting each baseline level of PA because no information is given about the total number of new enrollees surveyed.
(Choice E) The proportion of new enrollees who reported having an active baseline level of PA is 0.27 (not 0.91). The value 0.91 is the proportion of new enrollees who reported having a moderately active, active, or very active baseline level of PA (0.48 + 0.27 + 0.16 = 0.91).
Things to remember:
A relative frequency table gives the proportion of observations that fall into each category of a categorical variable.
Question
The frequency distribution of students by class in a random sample of 50 students in a particular academic year at a local college is shown in the table below.

The Office of Academic Affairs decides to reclassify students. It will now group freshmen and sophomores together as underclassmen and group juniors and seniors together as upperclassmen. Which of the following represents the relative frequency distribution of students for the new classification?
A.  |
|
B.  |
|
C.  |
|
D.
|
|
E. 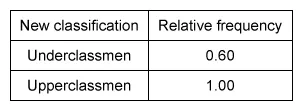
|
Hint:
A frequency table gives the number of observations for each category of a categorical variable.
A relative frequency table gives the proportion of observations for each category.
Explanation
A frequency table gives the number of observations that fall into each category of a categorical variable.
A relative frequency table gives the proportion of observations that fall into each category.
A proportion in fraction form represents a part (numerator) of a whole (denominator):
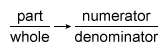
It is possible to calculate the entire relative frequency table, but notice that all the choices have a different value for upperclassmen. Calculate the proportion of upperclassmen in the sample.
The whole (denominator) is the total number of students in the sample.
The part (numerator) is the number of upperclassmen.

The number of students in the sample is 50, so the whole is 50.
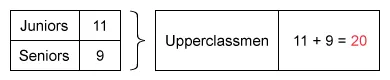
To find the part, add together the number of juniors and seniors (upperclassmen).
To calculate the proportion of upperclassmen, divide the number of upperclassmen (part) by 50 (whole).

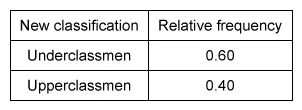
Among the choices, only Choice B shows a relative frequency table with a proportion of 0.40 for upperclassmen.
(Choice A) This table may result from mistakenly dividing the observed distribution in each class by 100, rather than by the total number of students in the sample (50).
(Choice C) This table represents a relative distribution where all classes have the same frequency of students, but the classes do not have the same frequency.
(Choice D) This table may result from mistakenly switching the frequencies of underclassmen and upperclassmen when creating the new classification table.
(Choice E) This table represents the cumulative distribution, not the relative distribution.
Things to remember:
- A frequency table gives the number of observations that fall into each category of a categorical variable.
- A relative frequency table gives the proportion of observations that fall into each category.
Question
A teacher asked the 20 students in a classroom which season of the year they liked the most. The results of the survey are shown in the relative frequency table below. Notice that the information about students who liked fall the most is missing.
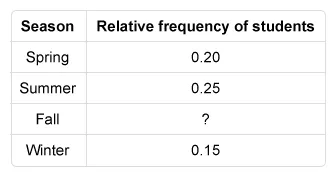
Which of the following is the frequency of students who liked fall the most?
| A. 8 | |
| B. 10 | |
| C. 12 | |
| D. 20 | |
| D. 40 |
Explanation
The relative frequencies must add up to 1, so the relative frequency of students who liked fall is 1 − 0.20 − 0.25 − 0.15 = 0.40. Multiply this relative frequency by the total number of students in the classroom to find the frequency: 0.40 × 20 = 8.

UWorld’s service is pretty good and helps provide a lot of explanations on subjects I haven’t been confident on before.
The questions here are the most realistic to the AP tests I've seen so far! I appreciate the ability to customize tests as well.
The best part is that all options are well-explained, telling clearly why they are not the right option.