
AP Environmental Science Practice Test: The Living World: Ecosystems
Passage
Question
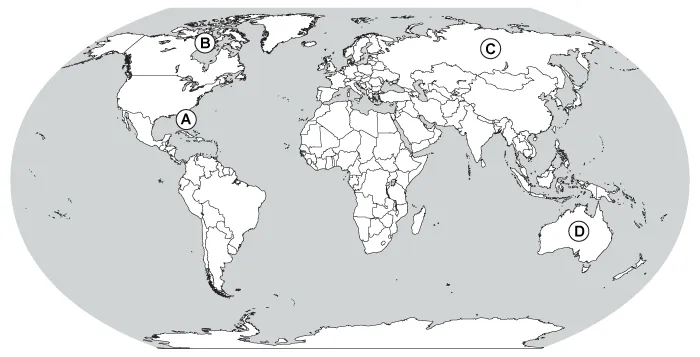
Taiga is the primary terrestrial biome in this area.
| A. A | |
| B. B | |
| C. C | |
| D. D |
Explanation
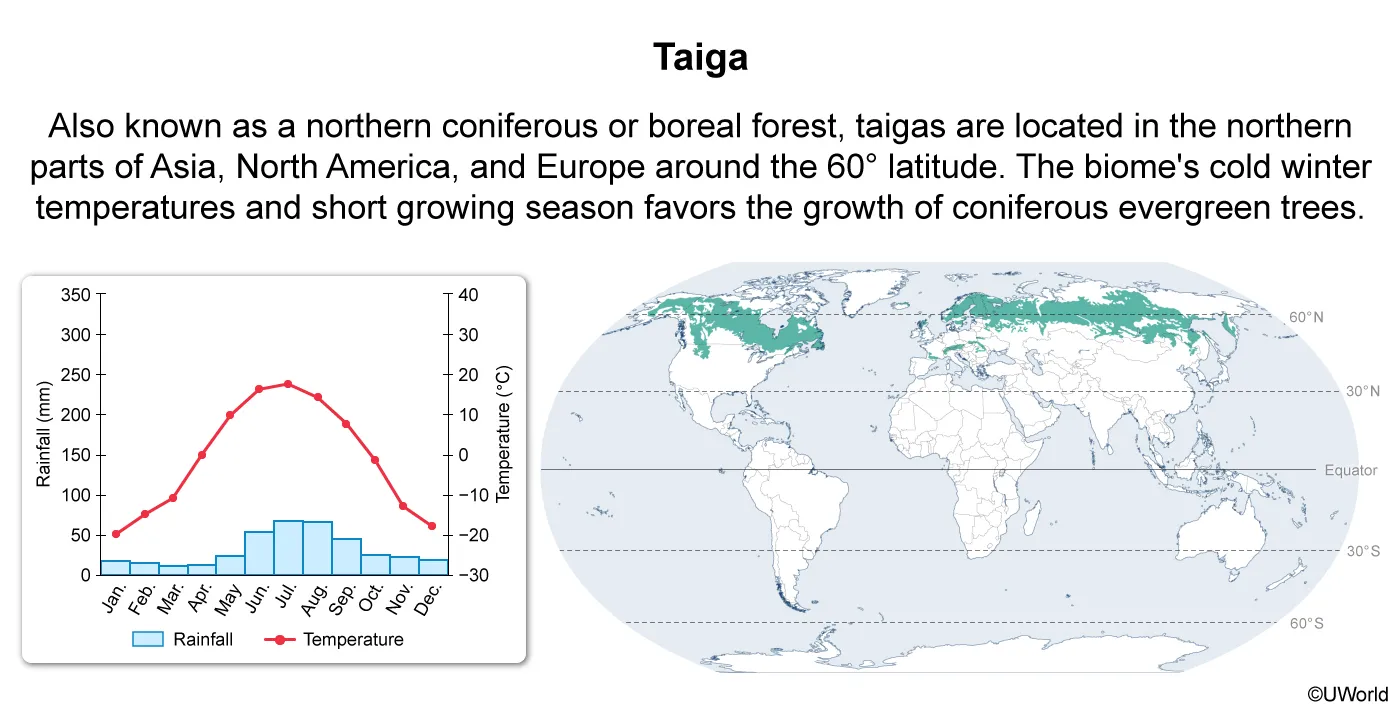
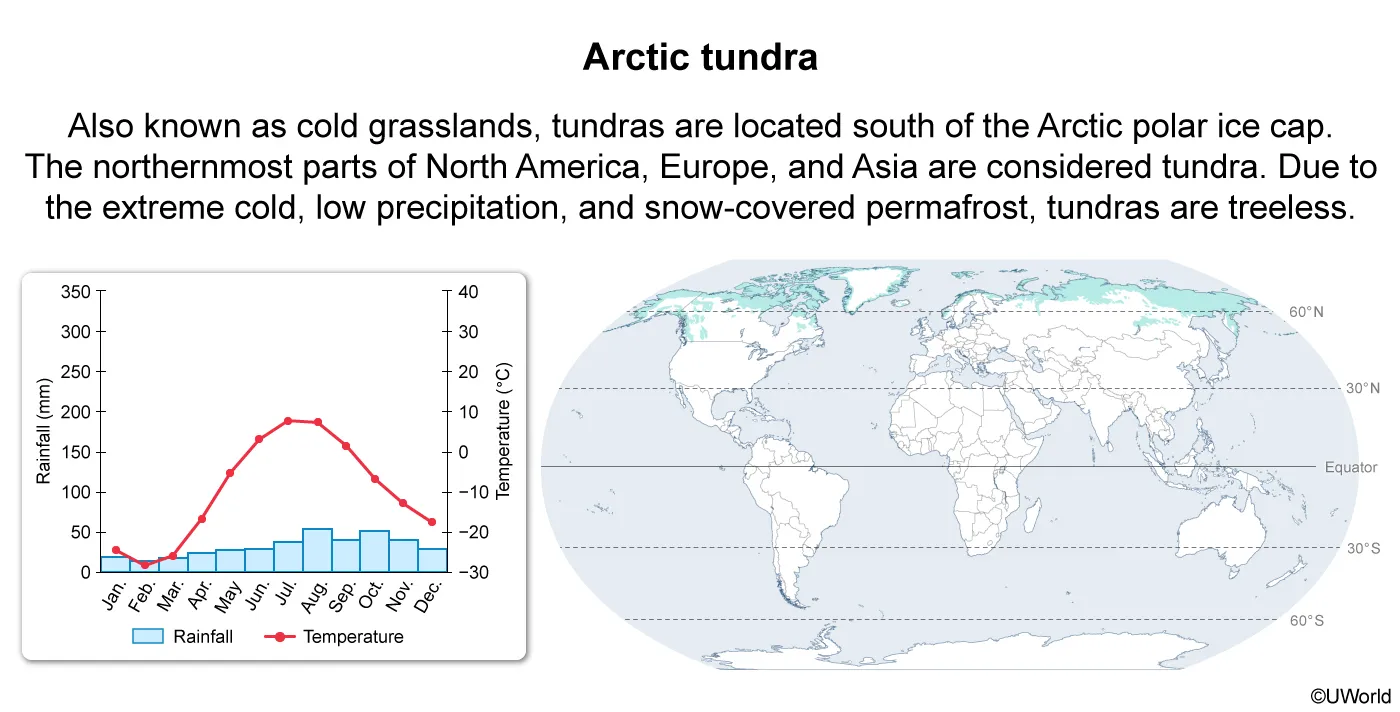
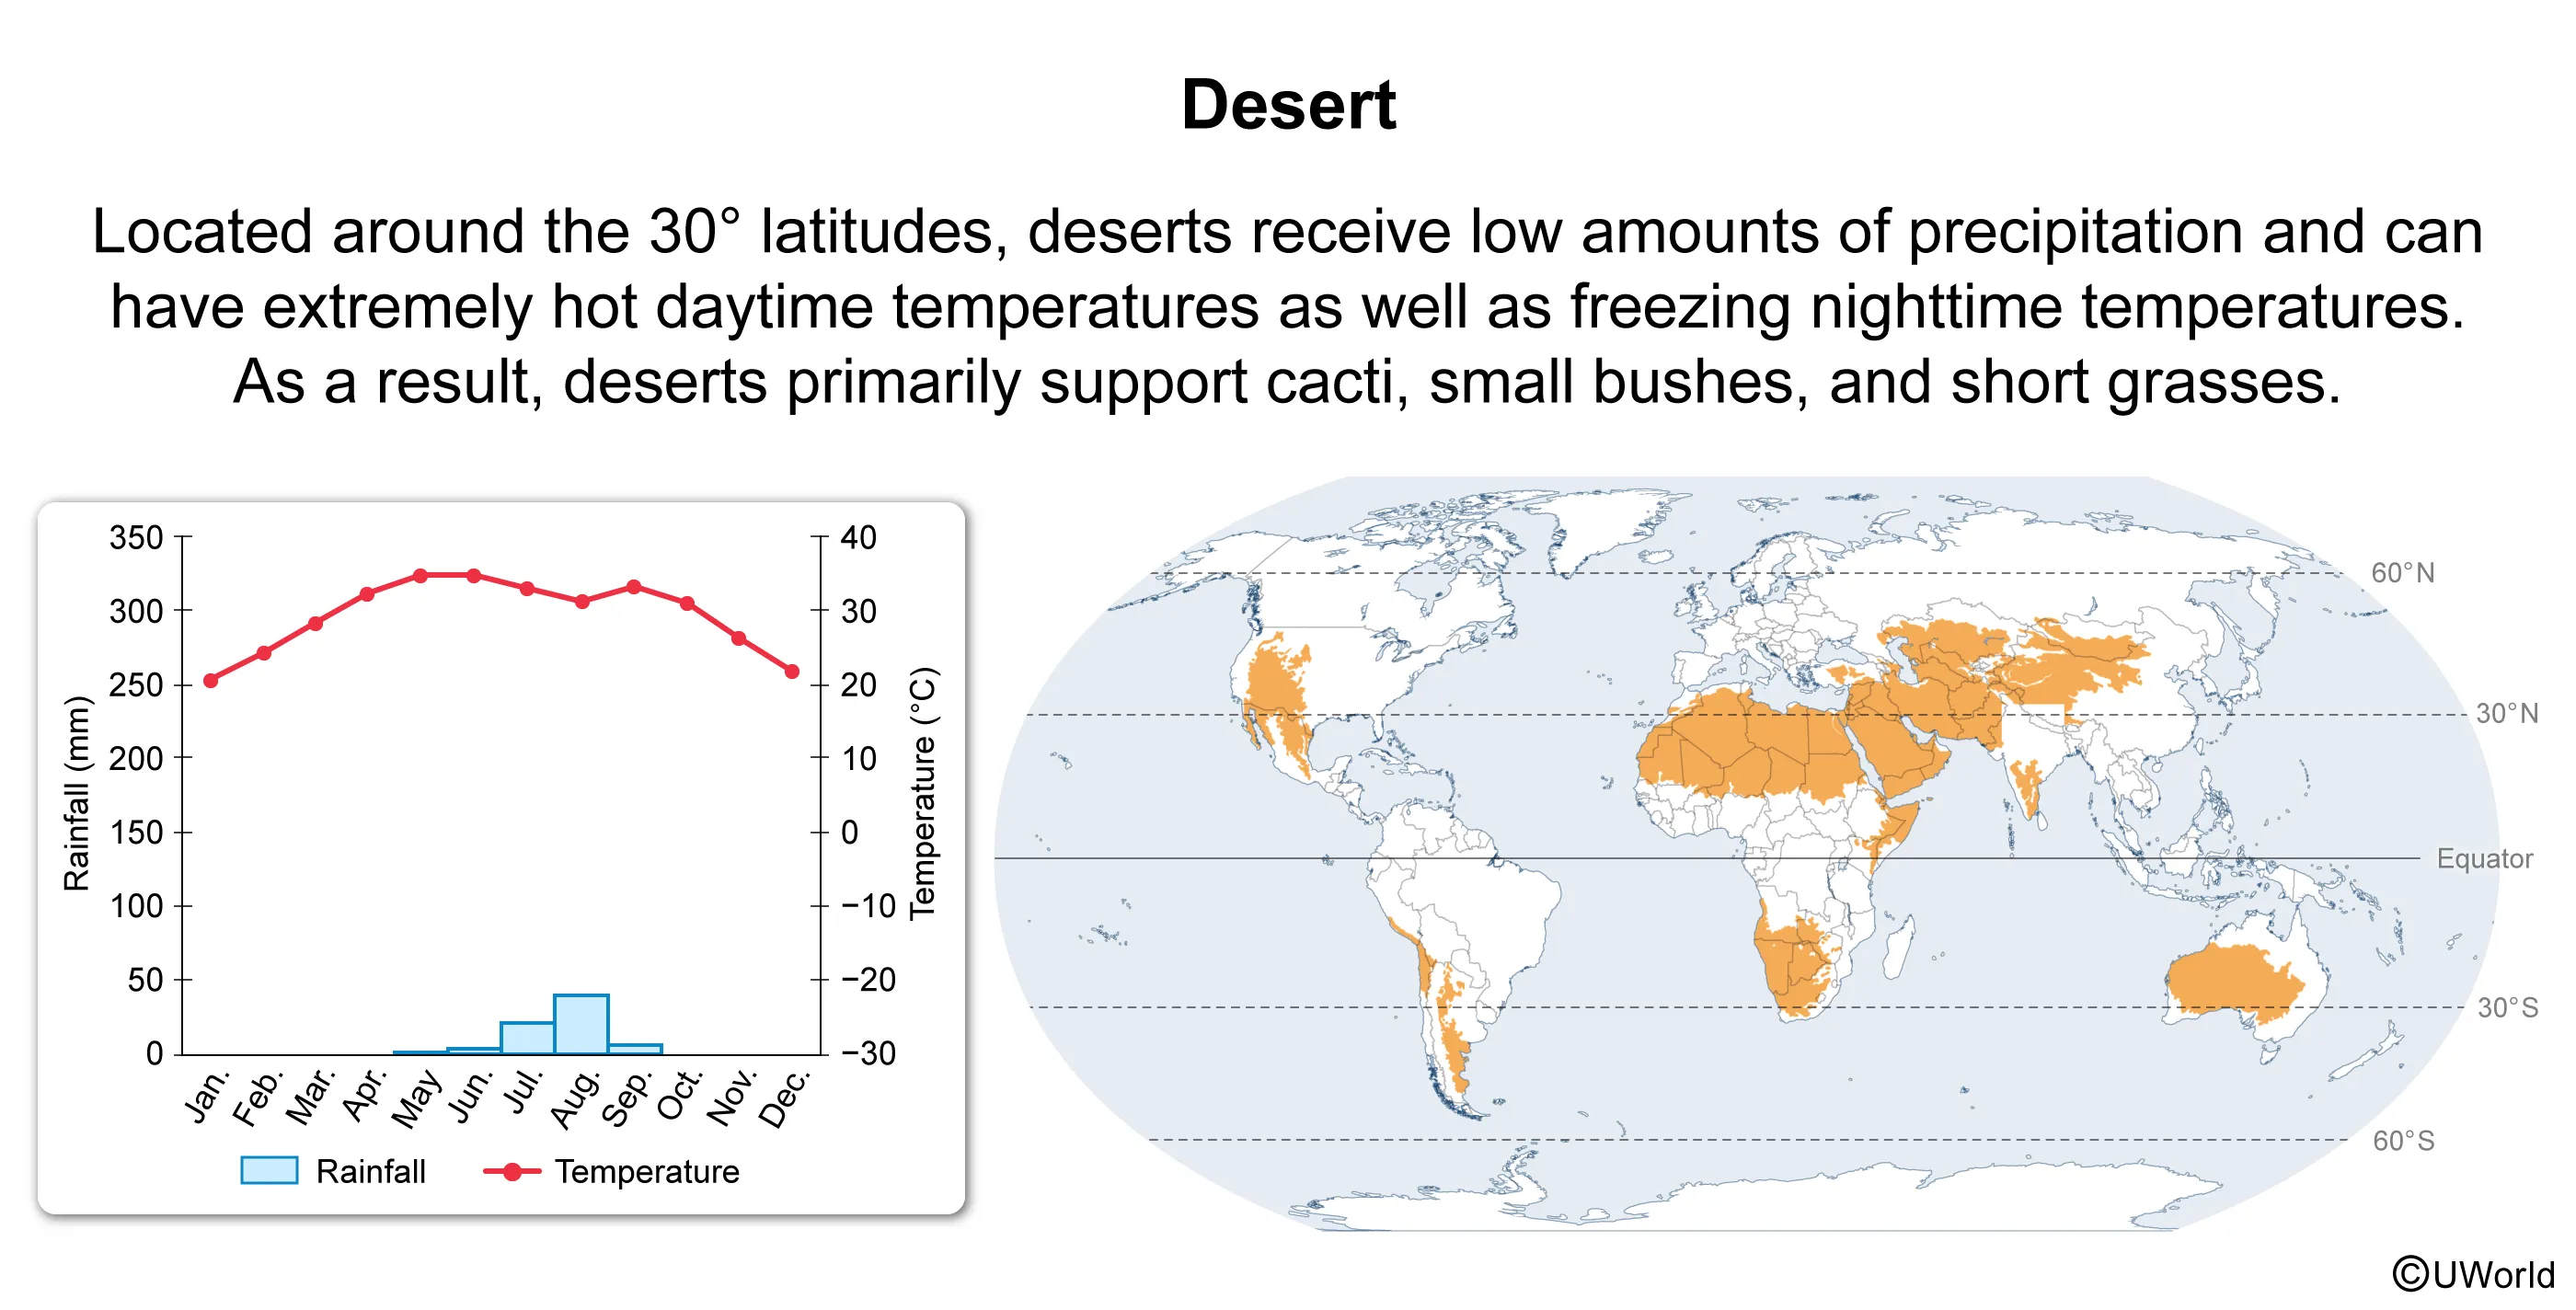
Taiga, also called a northern coniferous forest or boreal forest, is a terrestrial biome that has extremely cold winters. Due to the cold, taigas are primarily made up of coniferous evergreen trees such as hemlock, pine, spruce, fir, and cedar. The forest floor has low plant diversity due to the cold temperatures, short growing season, and acidic soil below the conifers. Nonetheless, these forests support numerous animal species that have adapted to living in this biome; these species range from bears that hibernate to rodents who burrow to escape the cold.
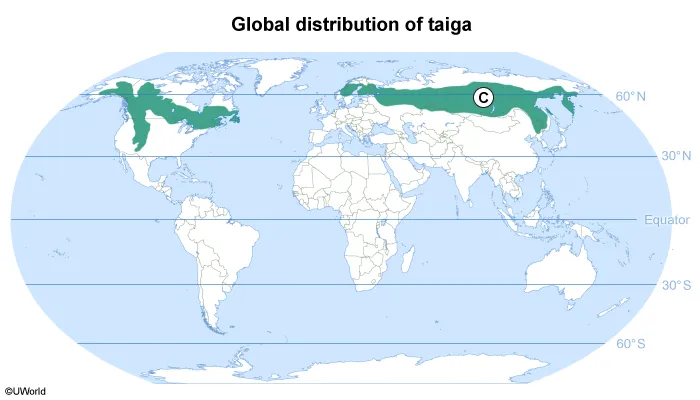
Taigas are located between the latitudes of 50°N and 70°N, just south of the arctic tundra in the northern parts of Asia (Choice C), North America, and Europe.
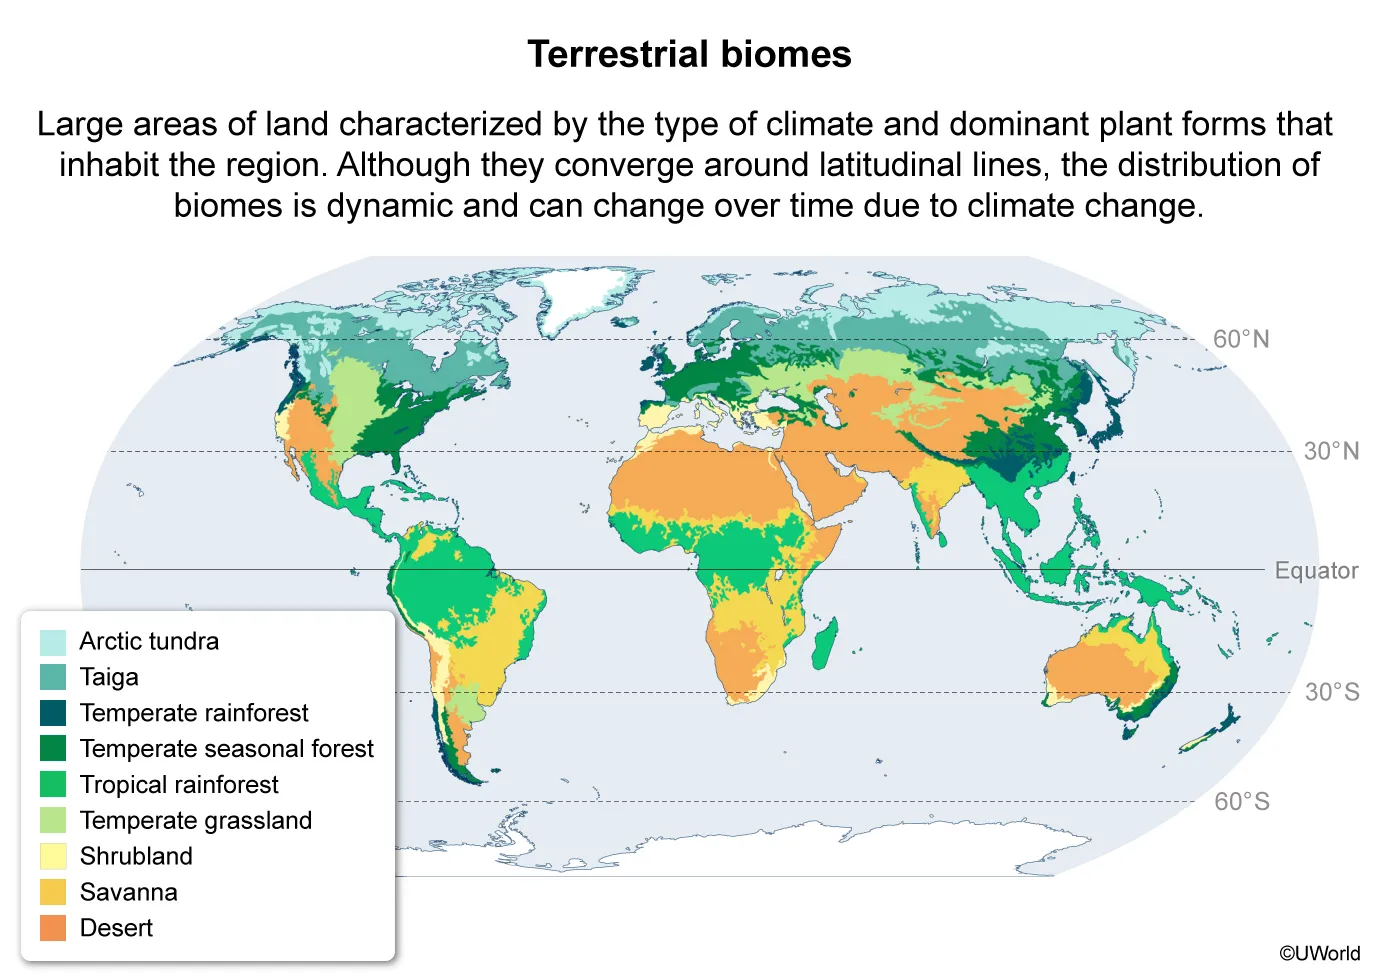
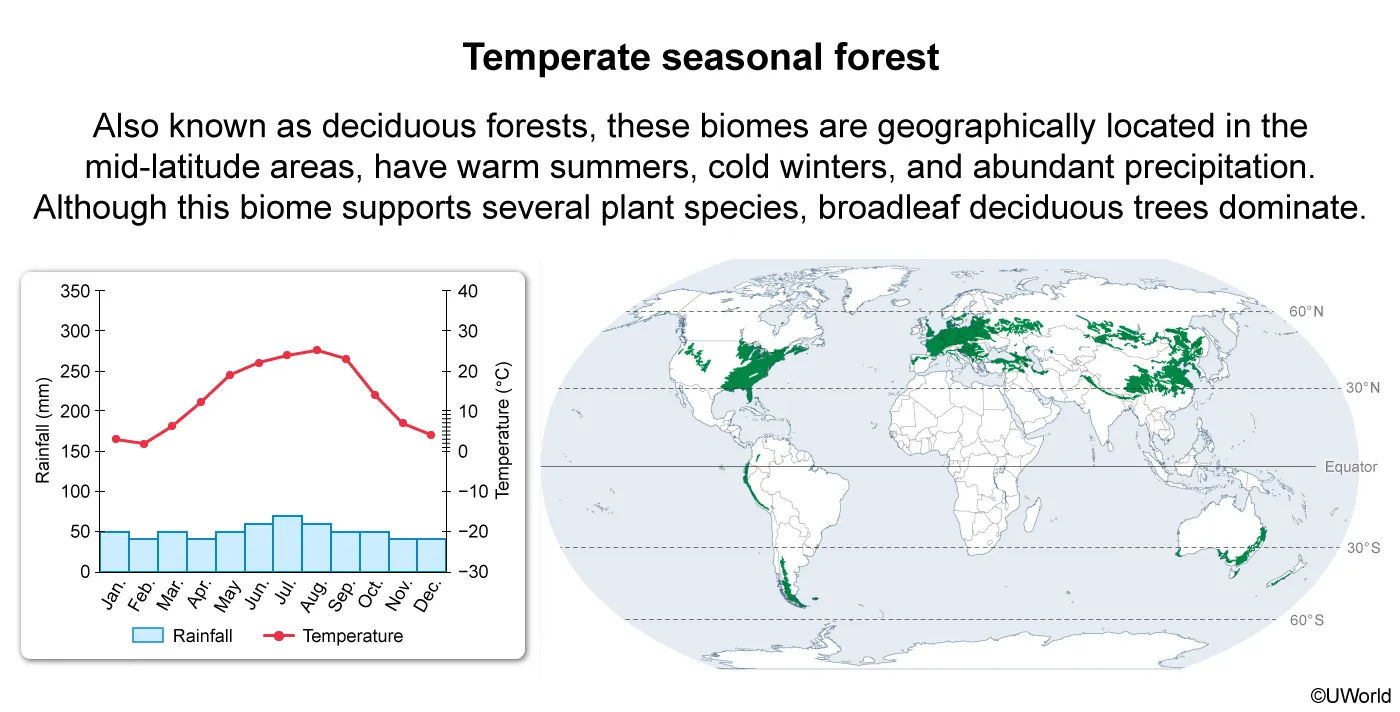
(Choice A) Temperate seasonal forest is the primary terrestrial biome in this area.
(Choice B) This area's biome consists of arctic tundra.
(Choice D) The primary biome in Central Australia is desert.
Things to remember:
Taiga, also called northern coniferous forest or boreal forest, is a terrestrial biome found in northern parts of Asia, North America, and Europe, just south of arctic tundra in those regions.
Passage
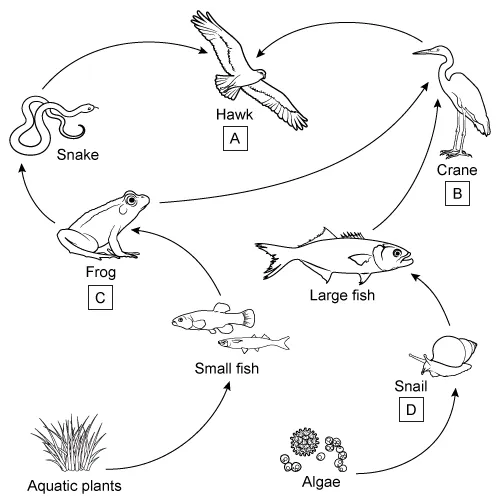
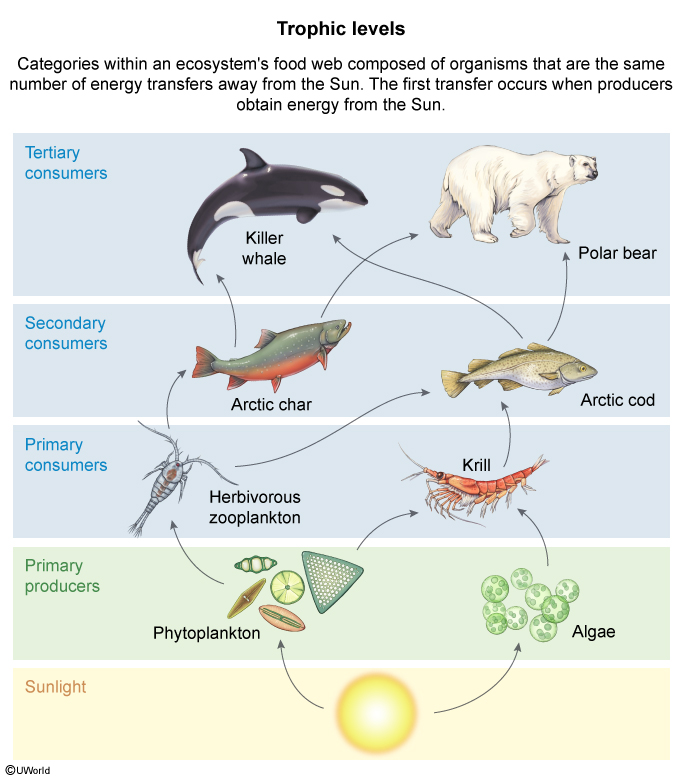
The diagram illustrates a food web of a salt marsh community. The consumers at different trophic levels are labeled A to D.
Question
This consumer is the predator of a primary producer.
| A. A | |
| B. B | |
| C. C | |
| D. D |
Explanation

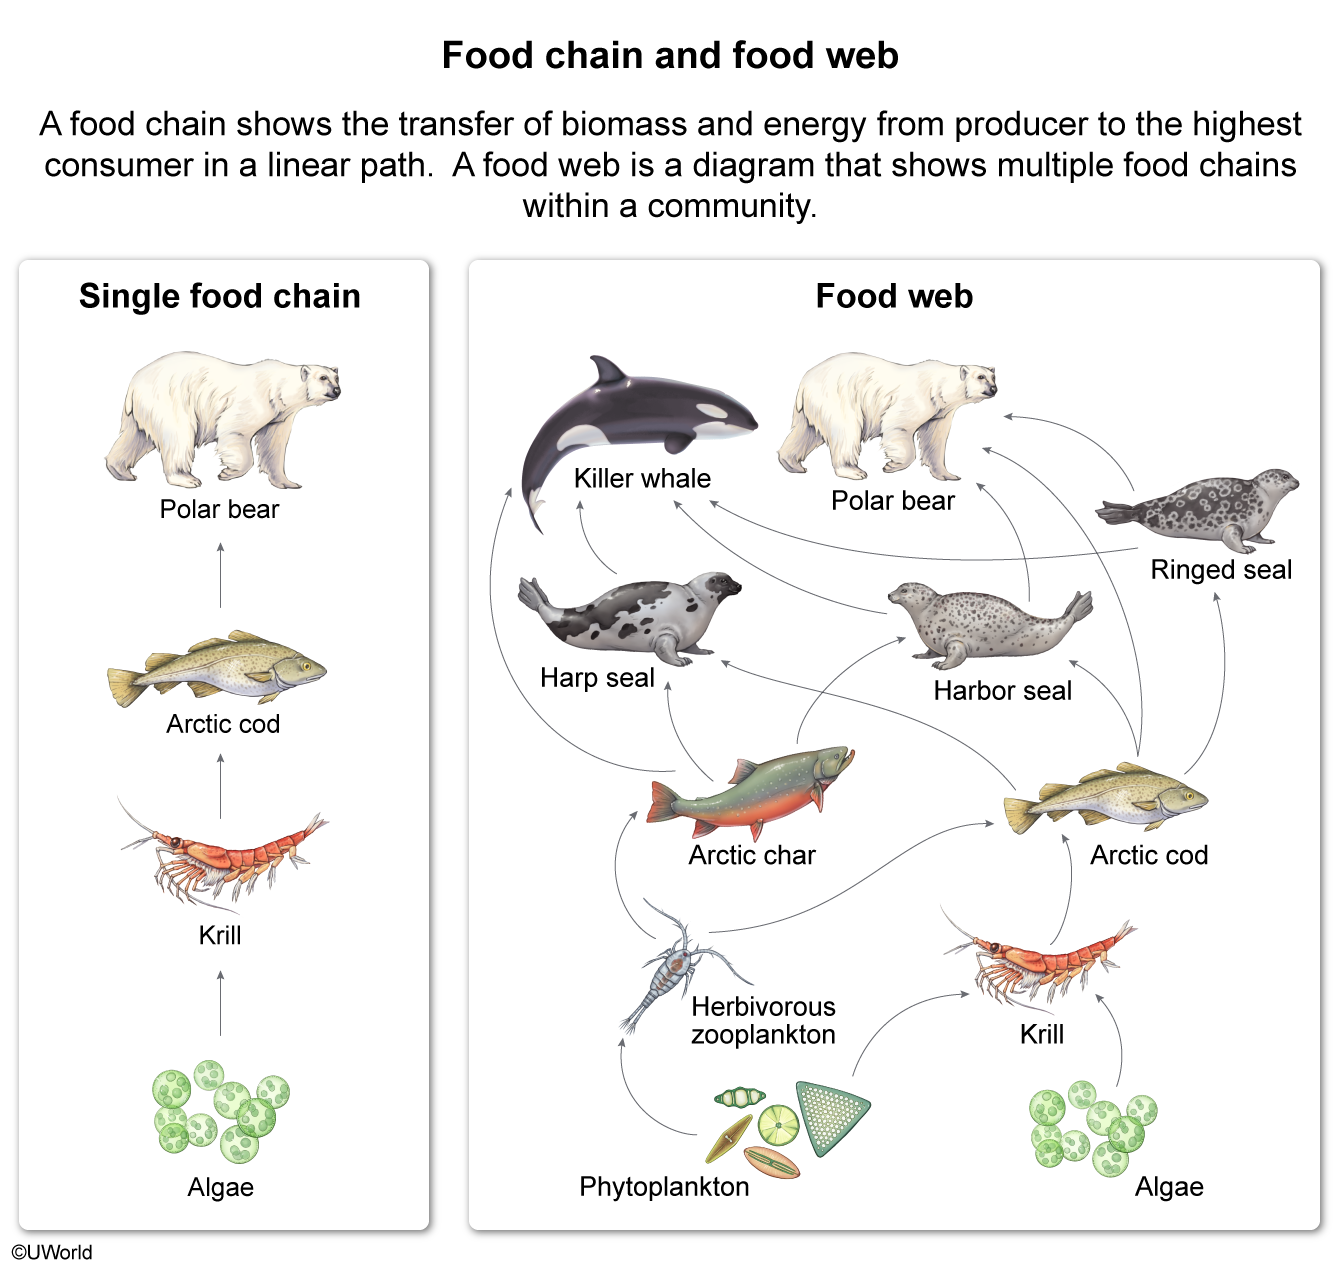
Food webs—diagrams that depict the flow of energy and nutrients between organisms within an ecosystem—are made up of multiple interconnected food chains. In a food web, energy and nutrient flow is shown as an arrow that points from the prey (organism that is consumed) to the predator (organism that consumes prey).
This energy flow shows predator-prey relationships between lower and higher trophic levels. In the food web of a salt marsh community, the primary producers include aquatic plants and algae. These primary producers are eaten by primary consumers, such as insects, small fish, and snails (Choice D).
(Choices A, B, and C) Because the arrows pointing to the hawk, crane, and frog do not come from the plants or algae, these organisms are not the predators of primary producers.
Things to remember:
When one organism, the predator, eats another organism, the prey, the two are in a predator-prey relationship.
Question
The diagram shows how the tolerance range of two plant species in the same habitat could possibly be changed over many generations.
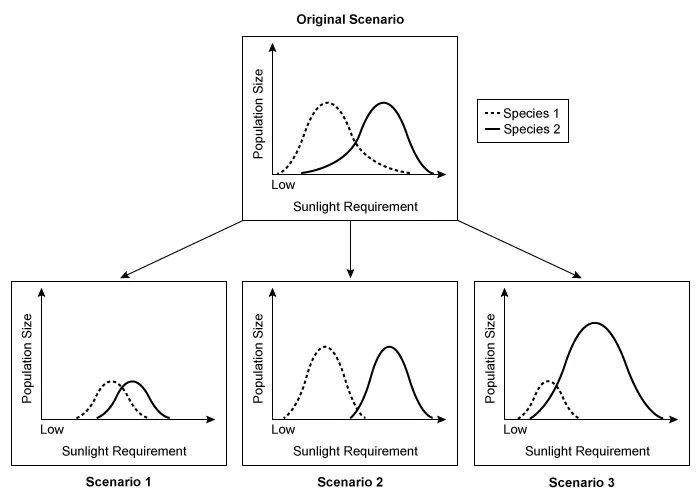
Which of the following correctly identifies the type of species interaction within each potential scenario in the diagram?
| A. Scenario 1 experiences resource partitioning, while Scenarios 2 and 3 experience competition only. | |
| B. Scenarios 1 and 2 experience competition, while Scenario 3 experiences resource partitioning only. | |
| C. All scenarios experience resource partitioning, but only Scenario 1 experiences competition. | |
| D. All scenarios experience competition, but only Scenario 2 experiences resource partitioning. |
Explanation
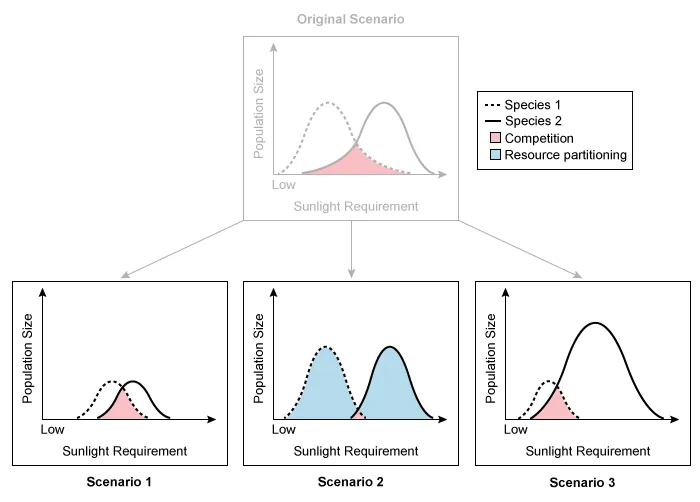
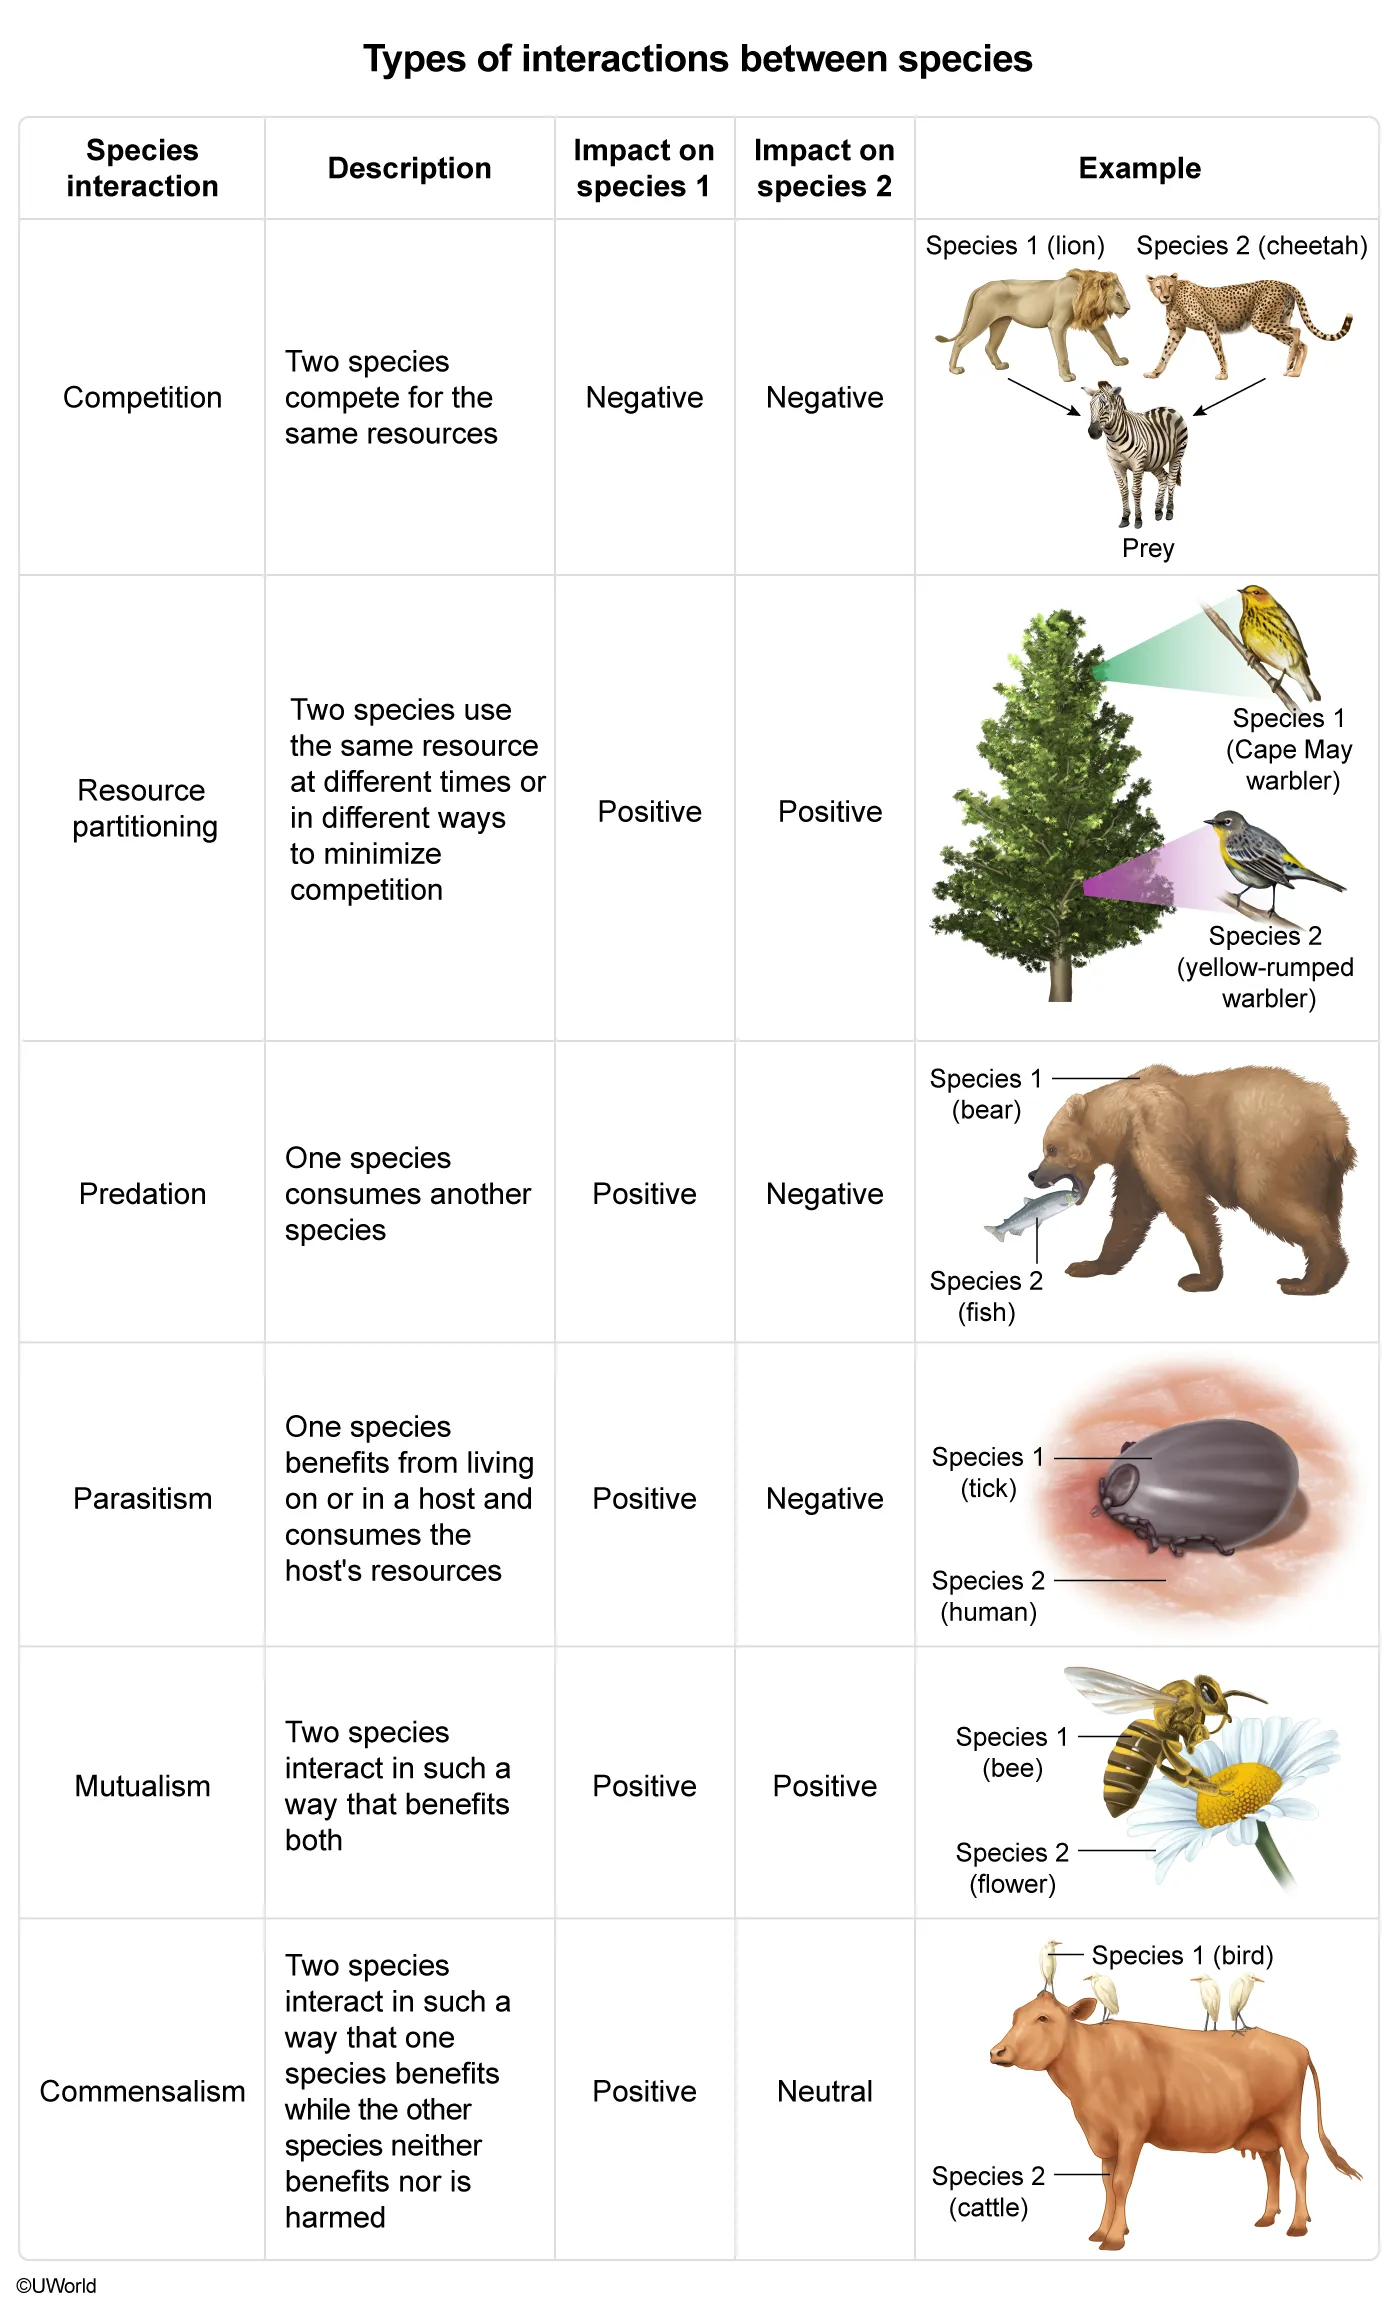
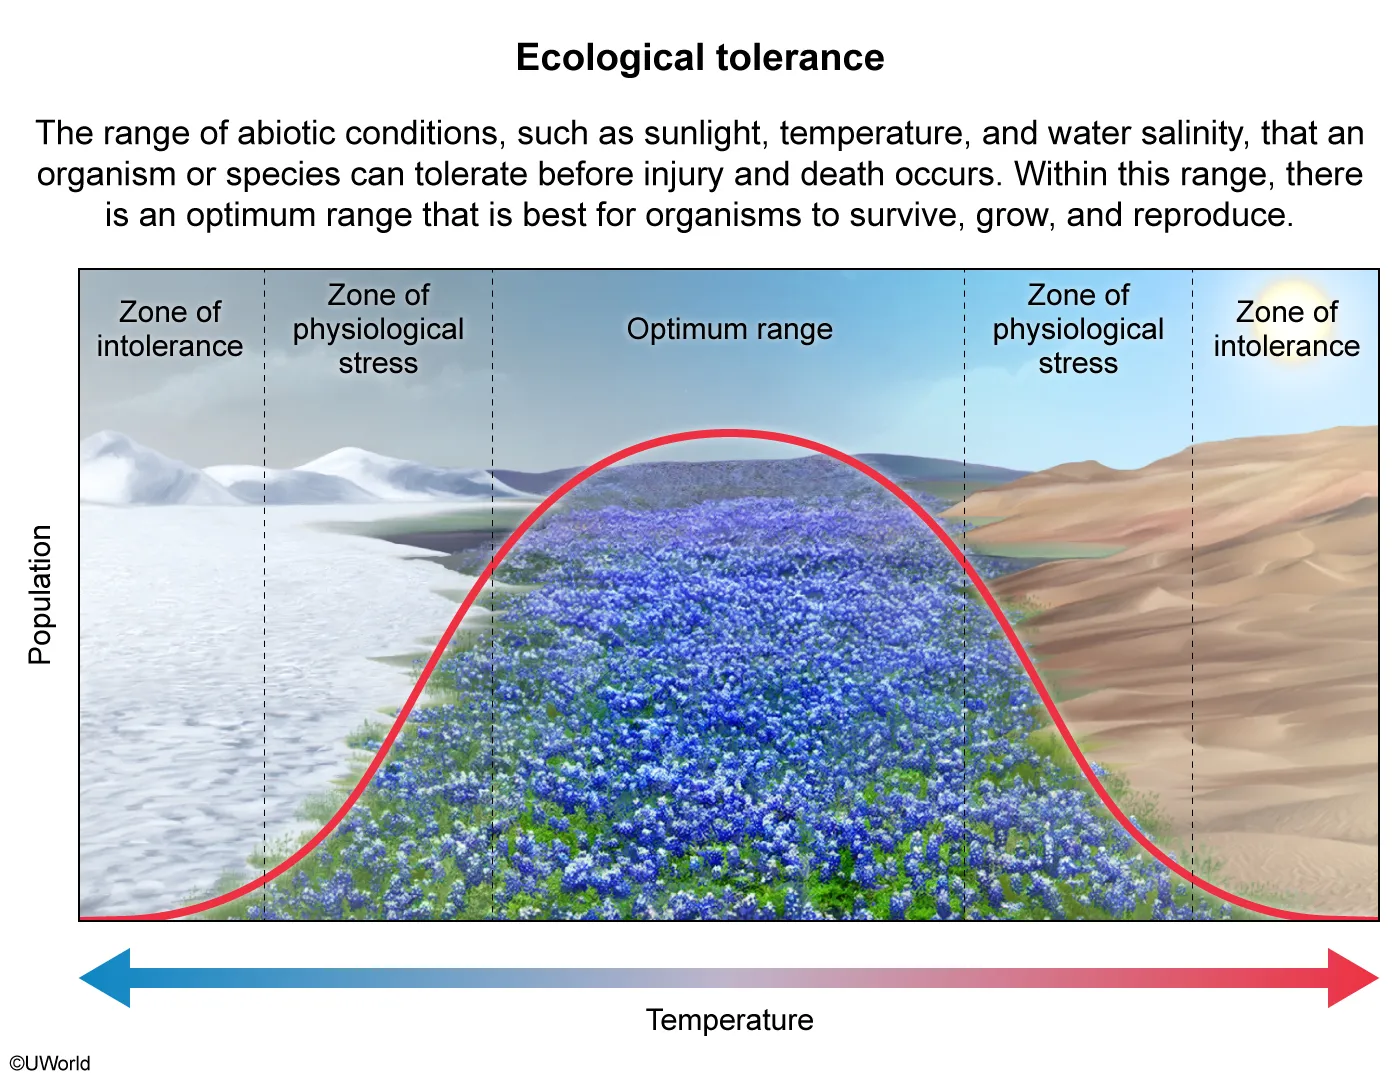
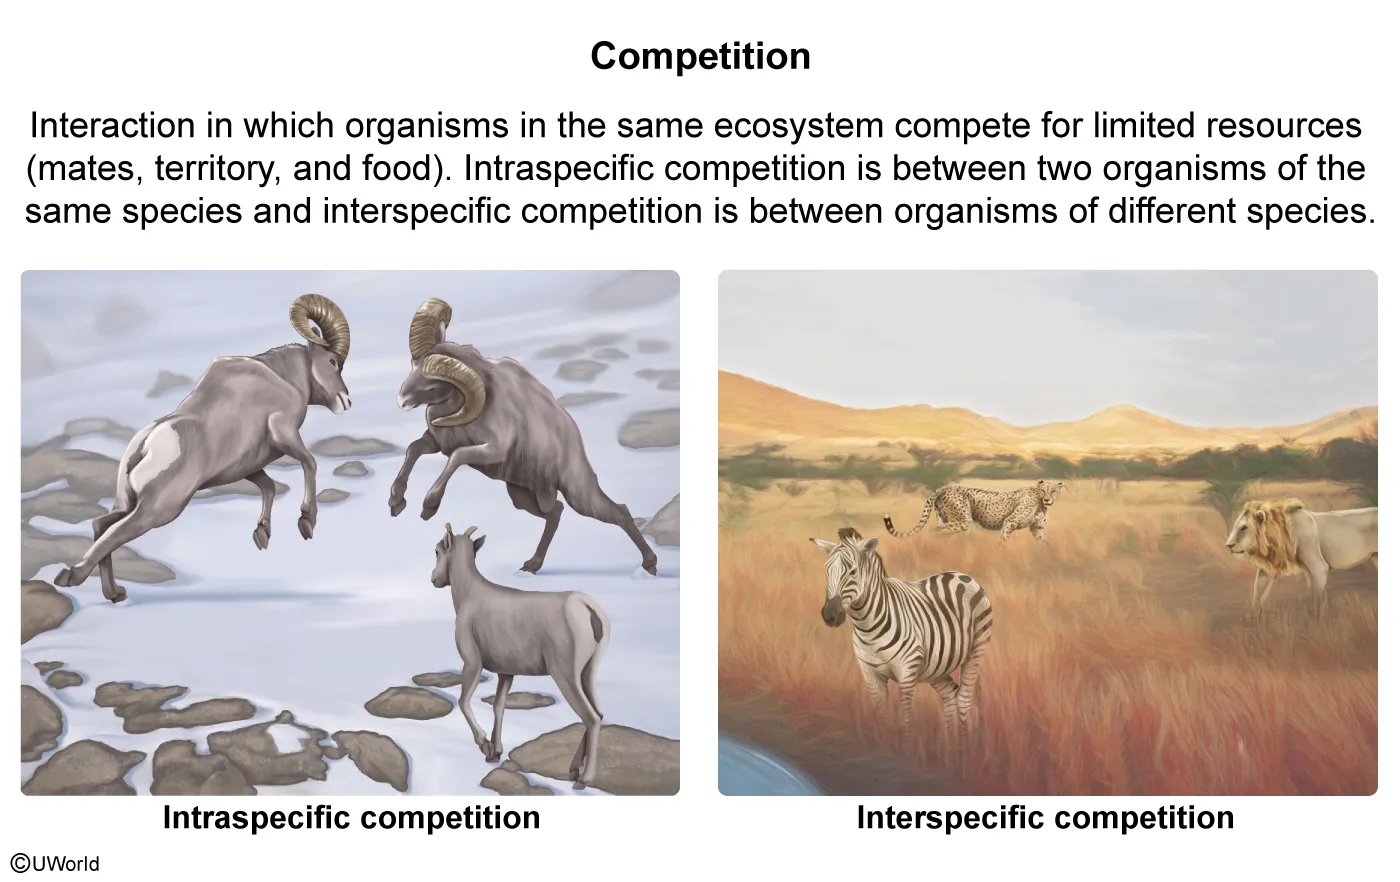
A tolerance range is the range of abiotic conditions, such as sunlight, to which an organism or species has adapted to survive. When two or more species have the same range of tolerance in the same habitat, competition occurs. Over many generations, competition can cause a shift in a species' tolerance range. For example, to minimize competition, organisms may engage in resource partitioning—sharing the same resource in different ways, in different places, or at different times.
The original scenario in the diagram shows the tolerance of two species for sunlight. Because there is some overlap in their ranges, competition occurs between the two organisms. In these scenarios, this competition has led to a shift in sunlight tolerance and population size.
-
Scenario 1: Reduced tolerance ranges and population sizes for both species, with large overlap between them.
-
Scenario 2: Reduced tolerance ranges and increased population sizes for both species, with less overlap between them.
-
Scenario 3: Reduced tolerance range and population size of species 1 and increased tolerance range and population size of species 2, with the majority of species 1 range overlapping.
Because all scenarios have an overlap in the tolerance ranges for both species, all scenarios experience competition. However, only Scenario 2 experiences resource partitioning because the sunlight requirement for each species has shifted to reduce competition.
(Choices A, B, and C) Because the majority of one or both species' tolerance ranges are overlapping in Scenarios 1 and 3, these scenarios are experiencing only competition, not resource partitioning.
Things to remember:
Resource partitioning—sharing resources in different ways, in different places, or at different times—can reduce the negative impacts of competition when resources are limited.
AP Environmental Science Practice Test: The Living World: Biodiversity
Question
In disturbed ecosystems, ecological succession will affect species richness, the total biomass, and the
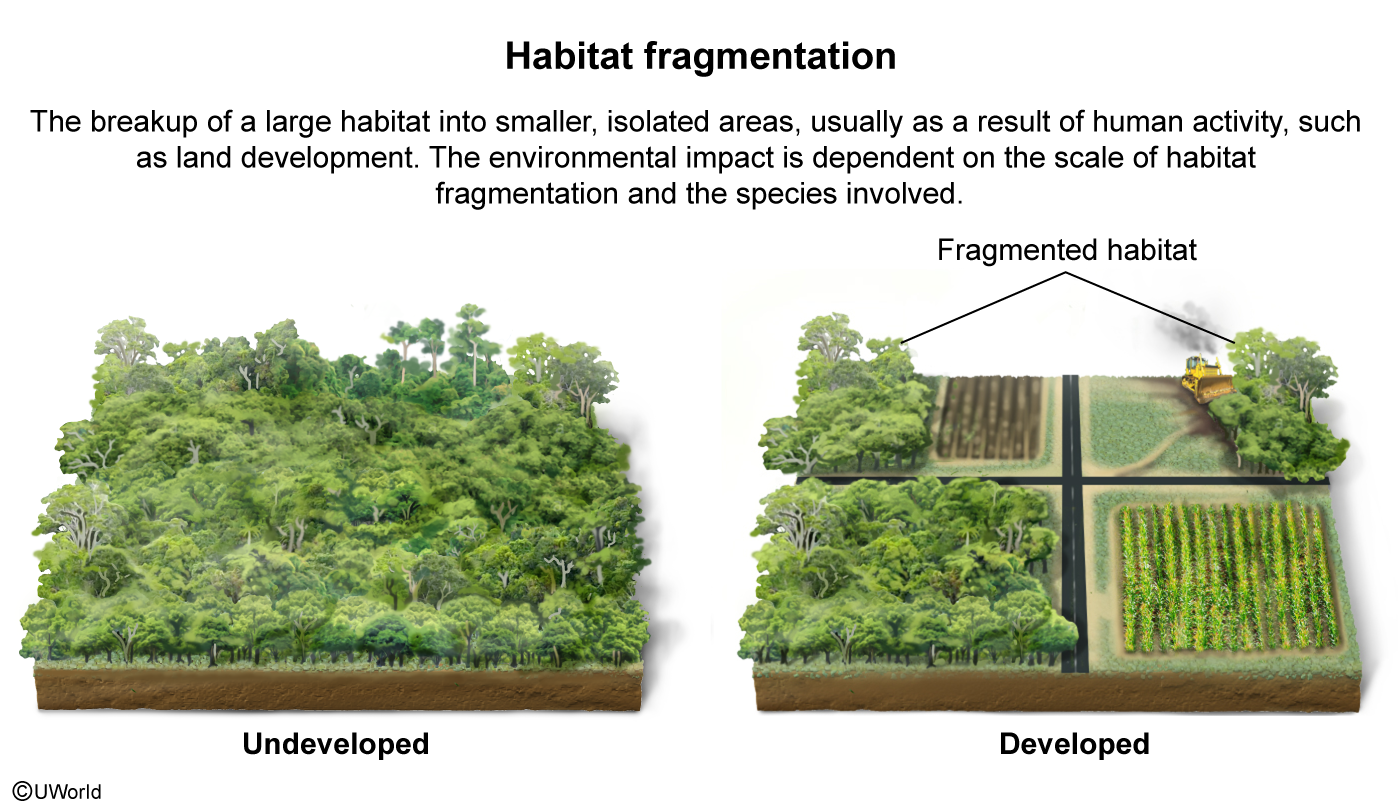
| A. rate of habitat fragmentation | |
| B. net primary productivity | |
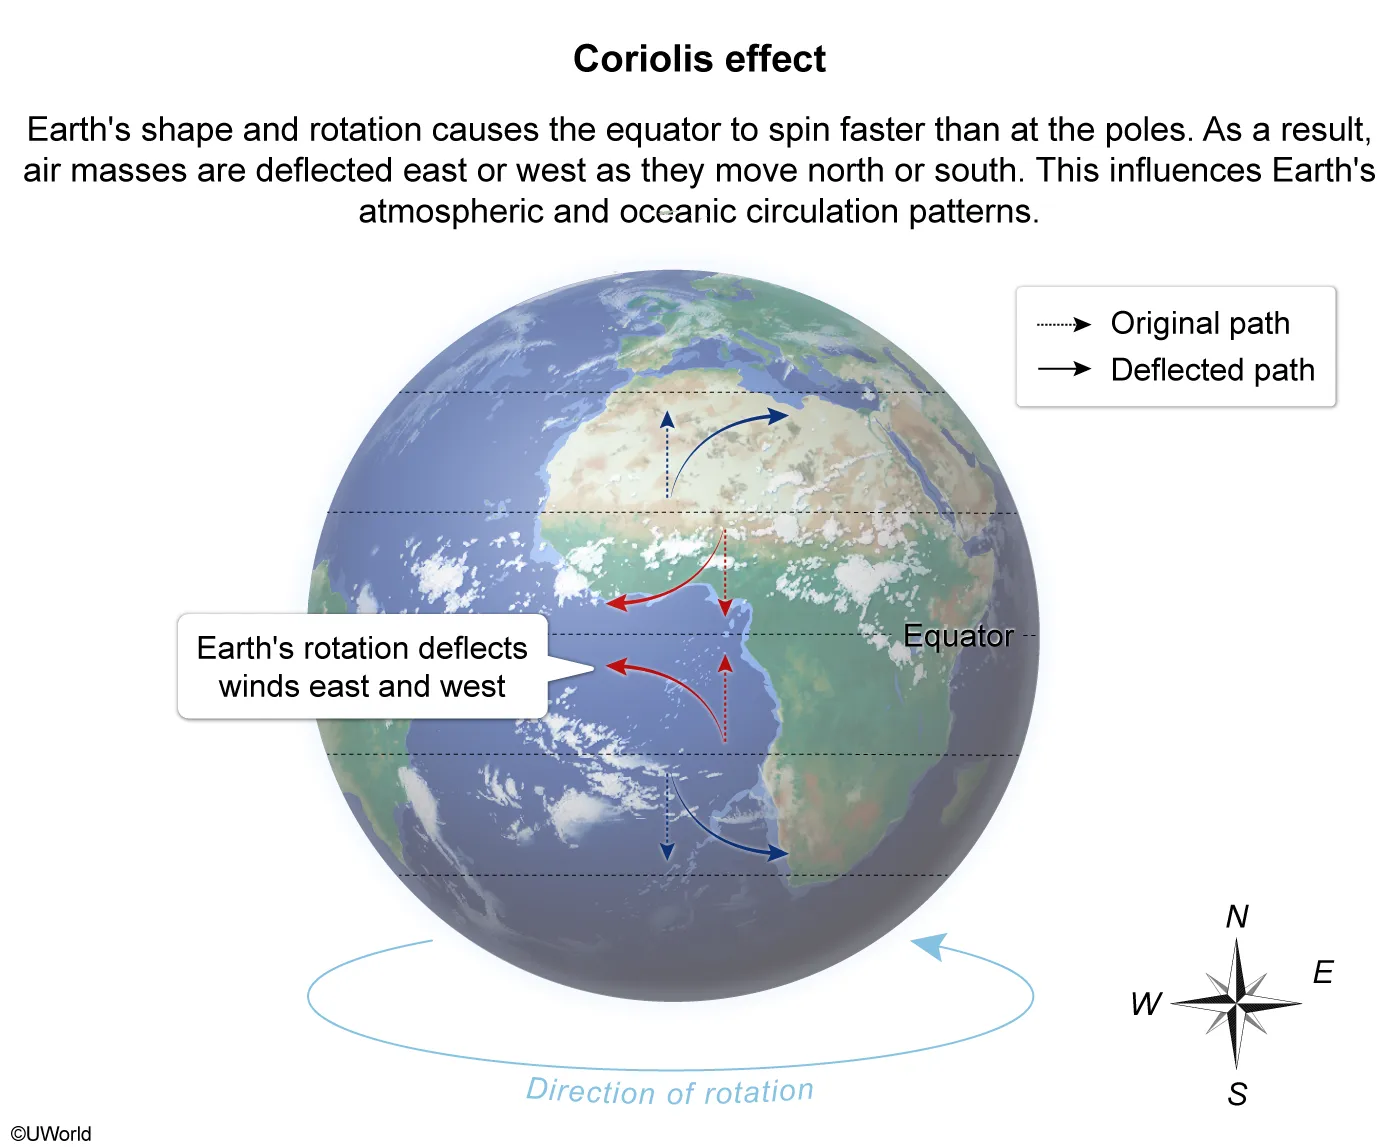
| C. Coriolis effect | |
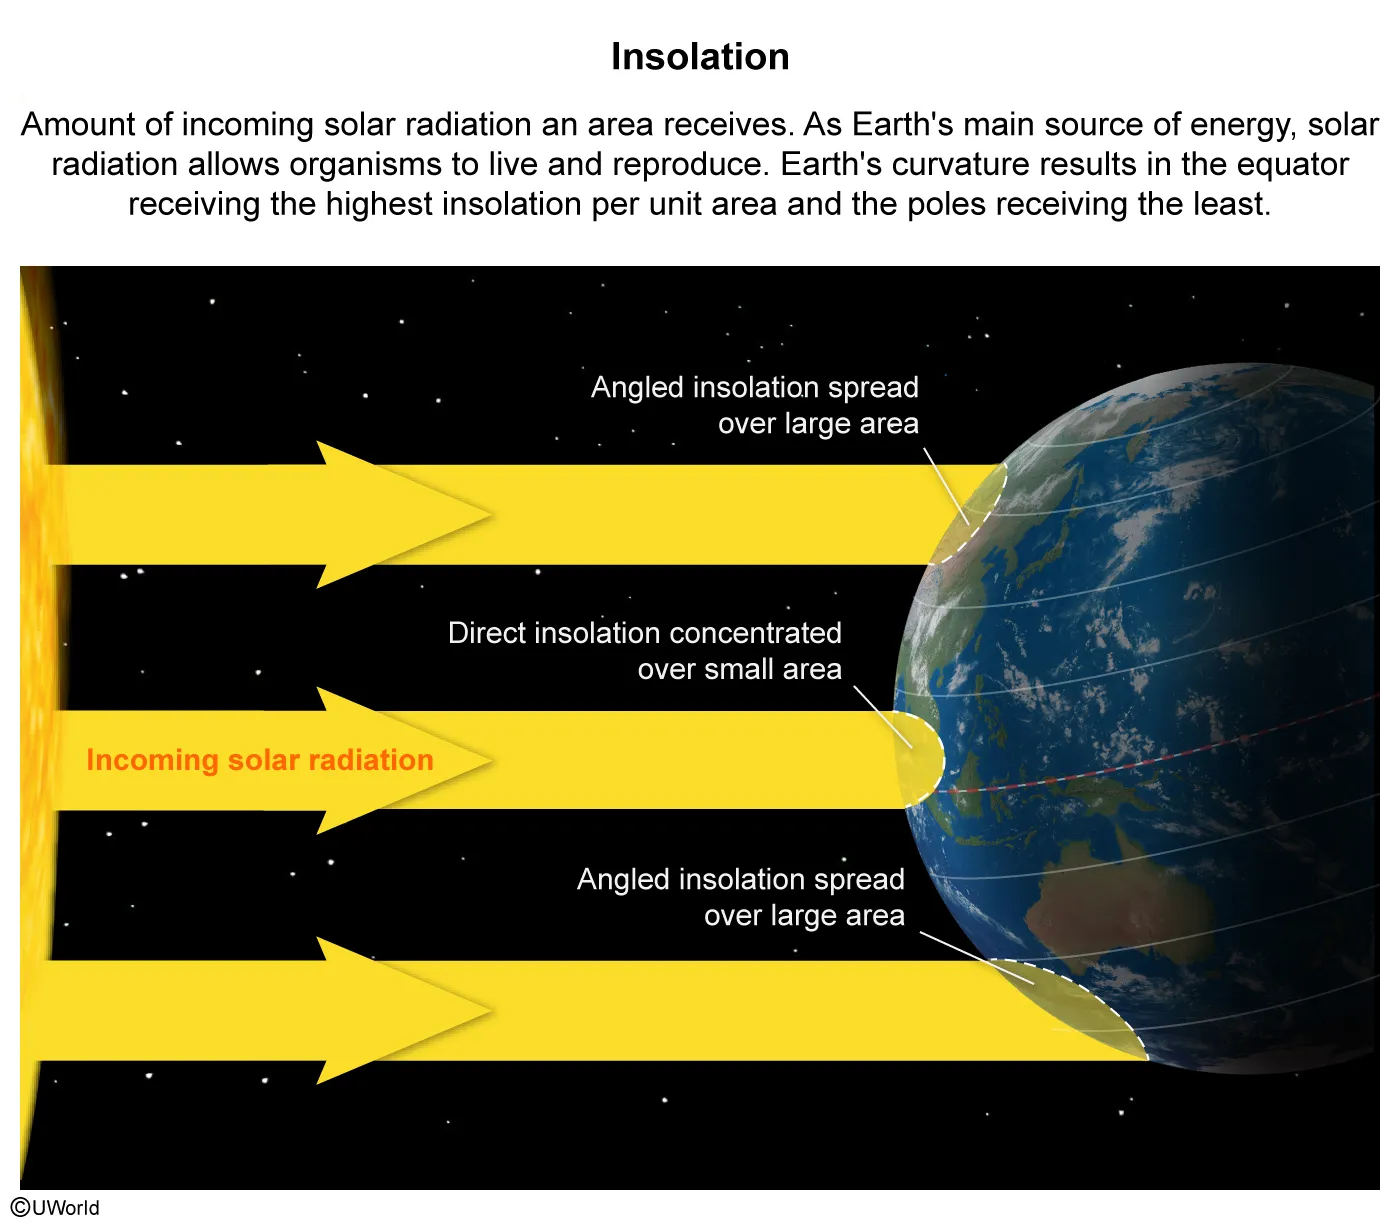
| D. incoming solar radiation |
Explanation
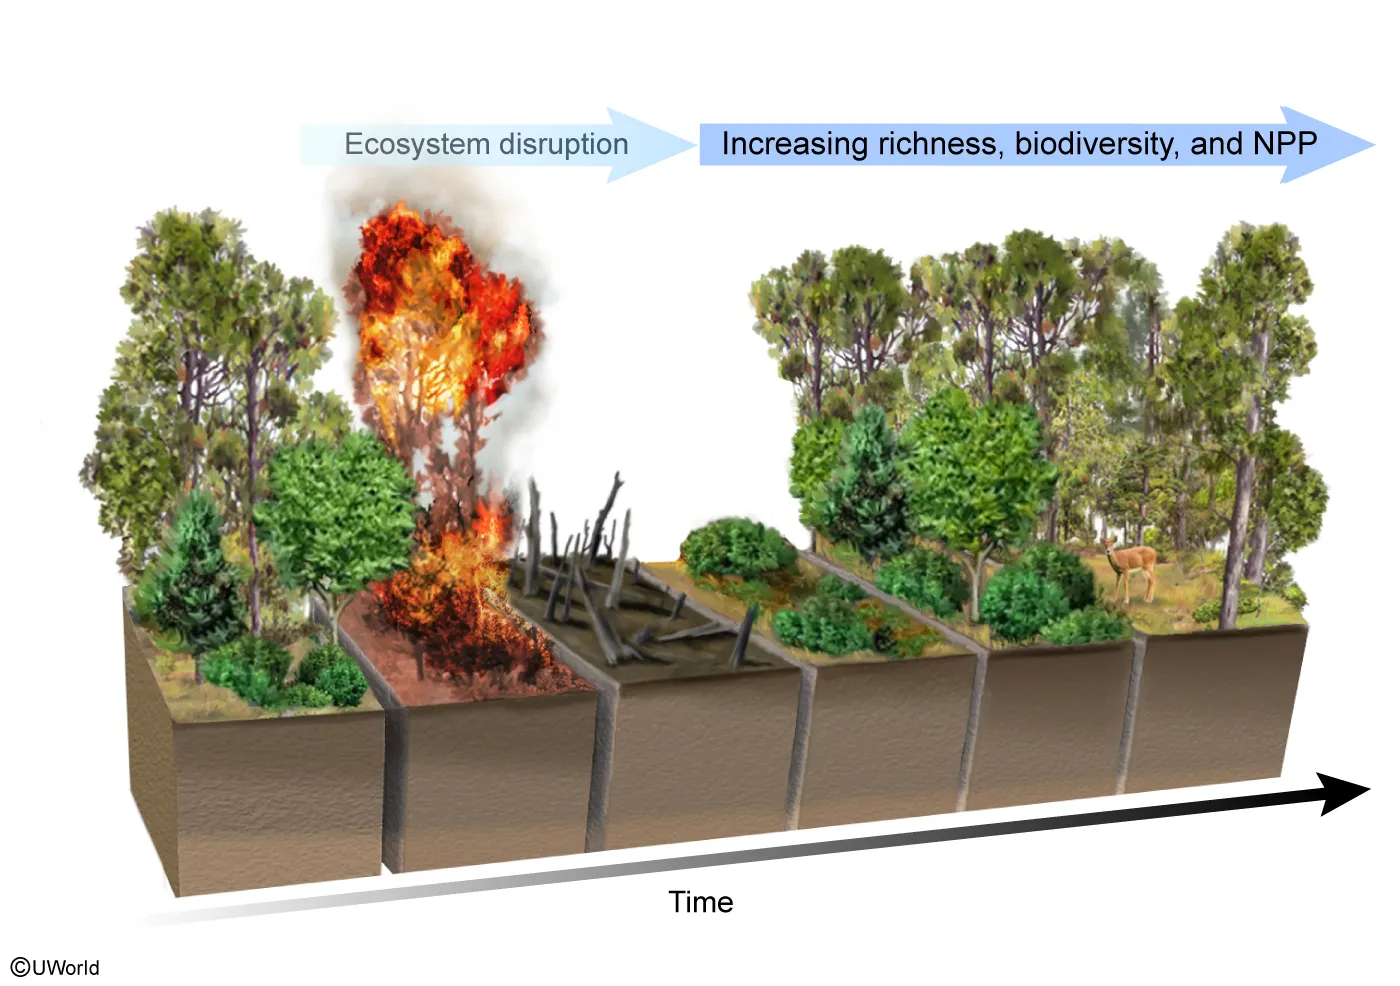
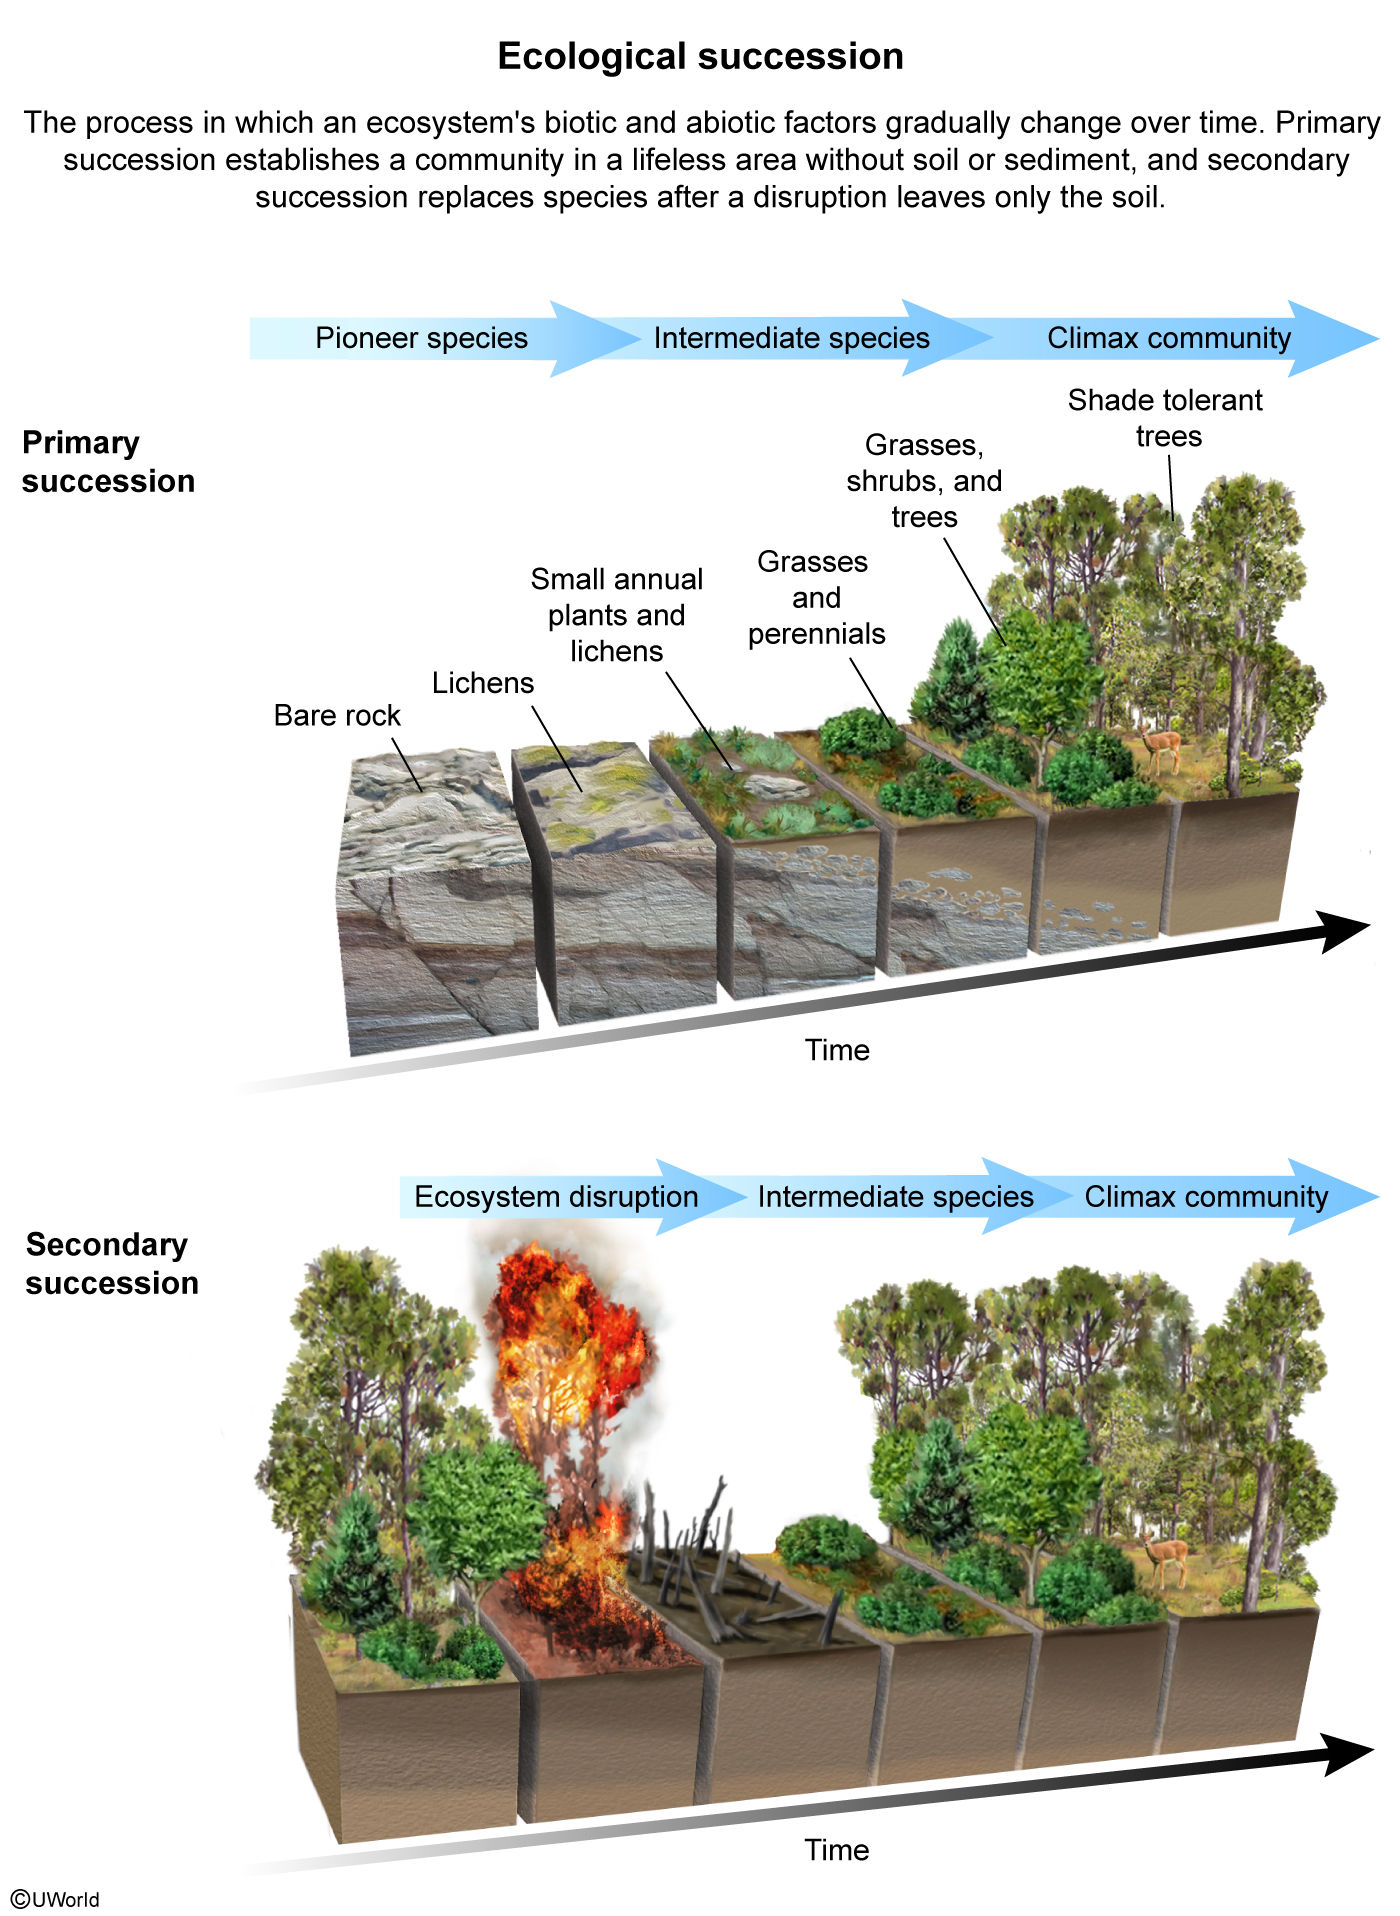
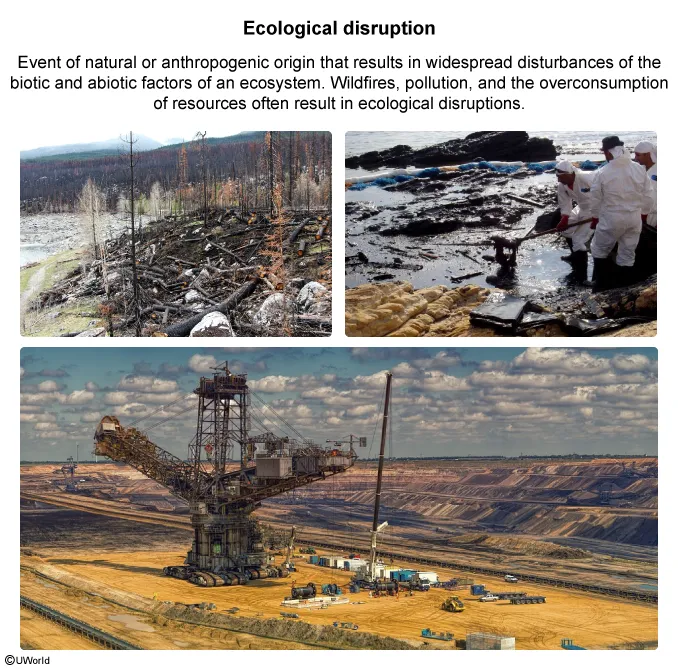
An ecosystem's biotic and abiotic factors gradually change over time in a process called ecological succession. Following a disruption event, such as a wildfire, ecological succession increases the following:
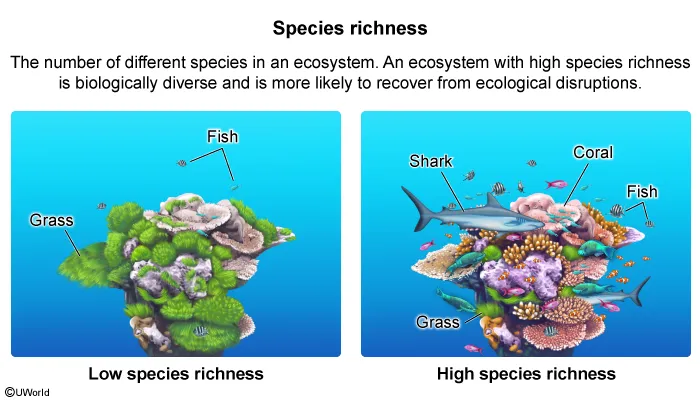
- species richness.
- total biomass.
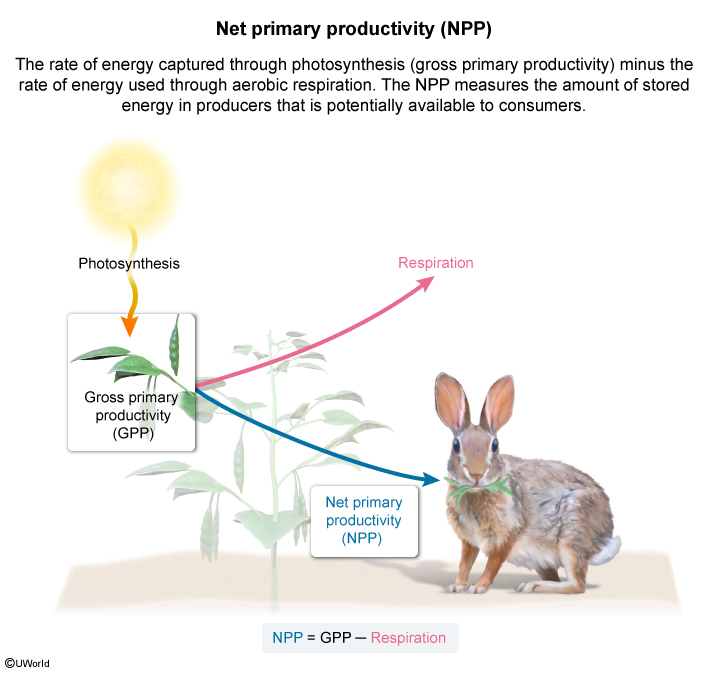
- net primary productivity (NPP).
(Choice A) Habitat fragmentation is an effect of anthropogenic activities, not ecological succession.
(Choice C) The Coriolis effect is not affected by ecological succession.
(Choice D) Incoming solar radiation is dependent on an ecosystem's geographic location, not on ecological succession.
Things to remember:
In disturbed ecosystems, succession will affect species richness, the total biomass, and net primary productivity.
Question
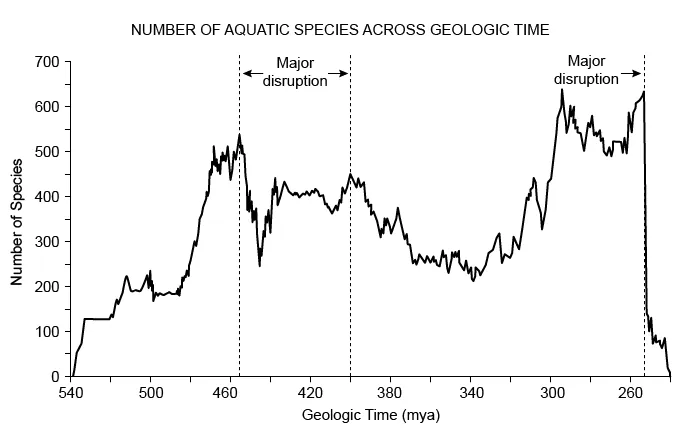
The graph below shows the estimated number of aquatic species and major disruption events in present-day China between 540 and 240 million years ago (mya).
Based on the data in the graph, which of the following methods could be used to calculate the percent change in the number of species from 400 mya to 360 mya?
| A. | |
| B. | |
| C. | |
| D. |
Explanation
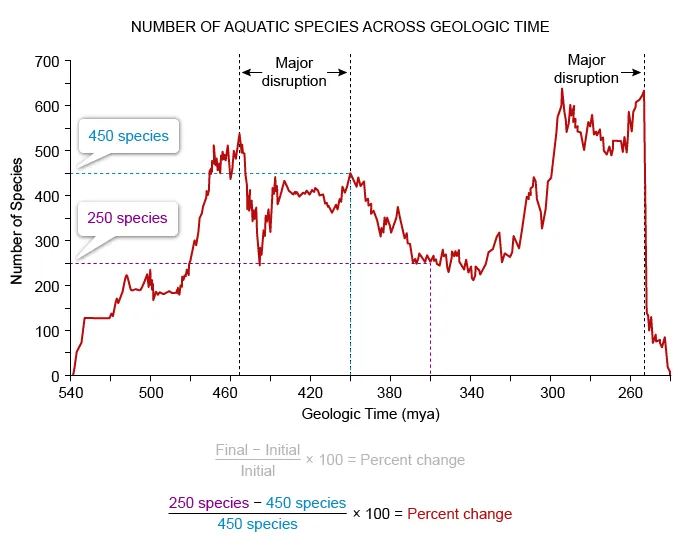
Throughout geologic time, natural disruptions, such as volcanic eruptions, asteroid impacts, and glaciations, have led to drastic environmental changes, including climate change, sea-level fluctuations, and the rearrangement of continents.
When these environmental changes alter large areas of habitat, mass extinction events may result, significantly decreasing the number of species in the affected region. For example, between 400 mya and 360 mya, a major environmental disruption in present-day China caused an extinction event that reduced the number of aquatic species from 450 species to 250 species. This resulted in an approximately 45% reduction in the number of species there, as determined by the percent change formula:
(Choices A and C) Because the question asks for the percent change in the number of species, the time span should not be included in the calculation.
(Choice D) This equation mistakenly swaps the placement of the values for the initial and final number of species in the percent change equation.
Things to remember:
Major changes in the environment, such as volcanic eruptions and asteroid impacts, can result in significantly altered habitats, which can cause extinction events.
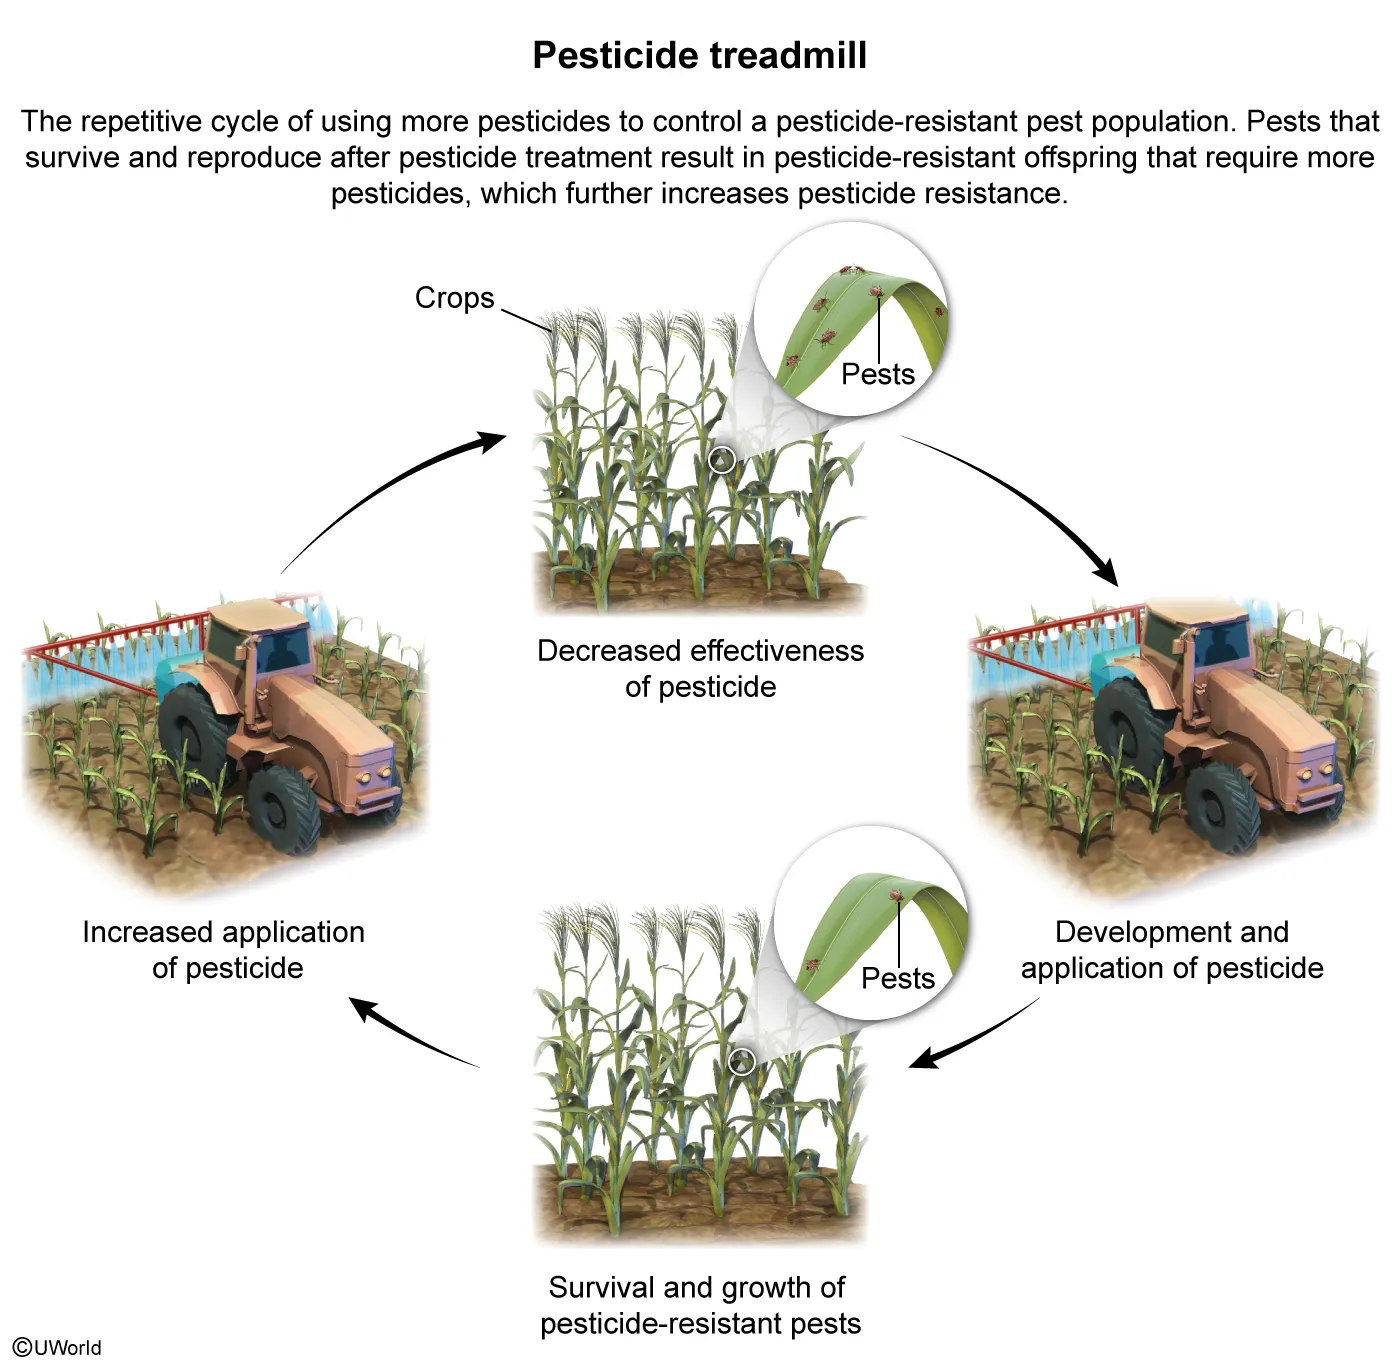
Question
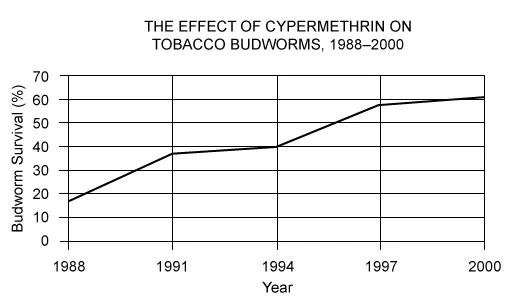
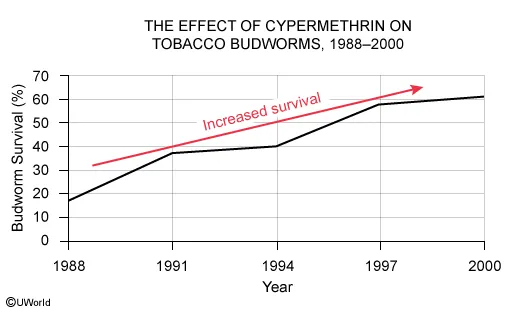
The graph above shows the percent survival of tobacco budworms after an annual application of a pesticide called cypermethrin over twelve years. Cypermethrin was sprayed one time each year, and a single concentration of the chemical was used during the twelve years.
Which of the following conclusions can be drawn from the data in the graph?
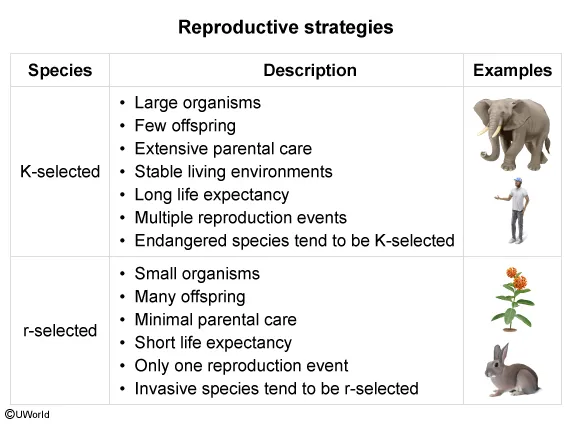
| A. The budworm is a K-selected species | |
| B. The cypermethrin concentration was too high | |
| C. The cypermethrin increased in effectiveness each year | |
| D. The budworm adapted to its environment |
Explanation
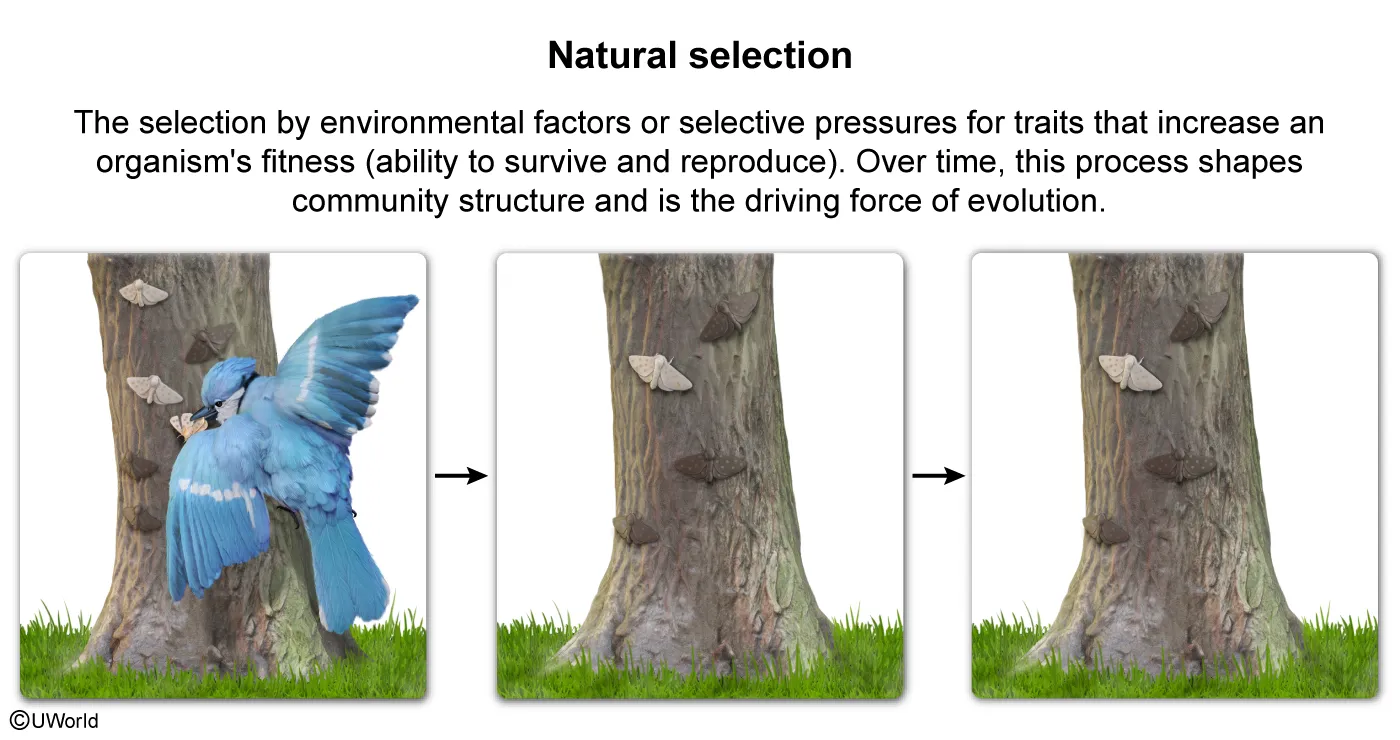
Changes to the environment, such as those caused by climate change or the spraying of pesticides, can impact the survival of individuals within a population. Because members of a population vary naturally, some individuals within a population can survive changes and pass on their traits to the next generation. Over time, these traits become more common within the population.
This phenomenon is the mechanism of natural selection by which species adapt to their environment through incremental changes at the genetic level. Although some genetic changes occur over long periods of time, such as speciation, other changes, such as pesticide resistance, can occur over a relatively short period of time.
According to the graph, cypermethrin had some initial effectiveness with killing the budworm. However, the percent of surviving budworms continually increased over time despite repeated pesticide application, which indicates that the budworm adapted to the cypermethrin in its environment.
(Choice A) An increase in survival despite the pesticide shows that the budworms have adapted over time, which is indicative of an r-selected, not a K-selected, species.
(Choice B) Because the survival of budworms never reached 0%, the cypermethrin concentration was most likely too low, not too high.
(Choice C) Because the budworm survival increased over the 12 years, the effectiveness of cypermethrin decreased, not increased.
Things to remember:
Over time, incremental changes at the genetic level enable organisms to adapt to their environment.
AP Environmental Science Practice Test: Populations
Question
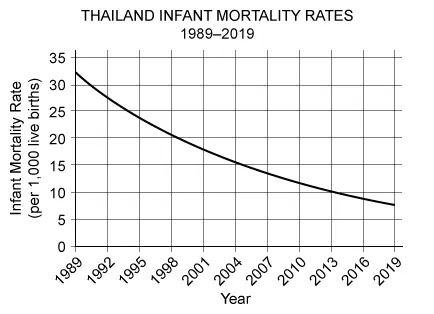
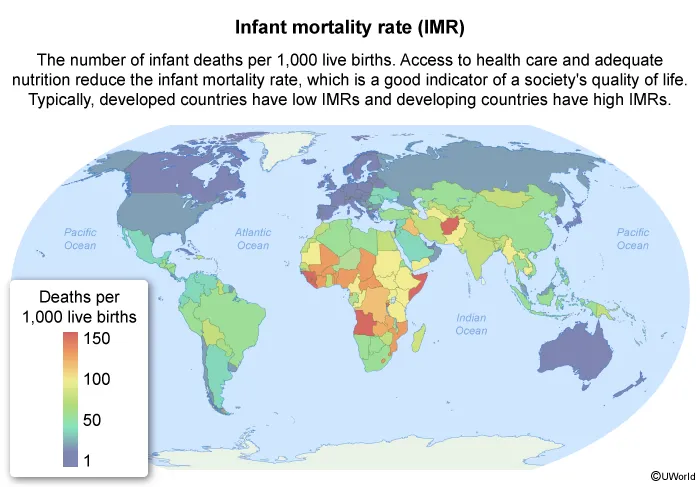
The infant mortality rate in Thailand has dropped from 1990 to 2019. The rate decreased partly because of the population's increased access to health care. Another likely cause for the decline is
| A. a decreased number of opportunities for women in the labor market | |
| B. decreased access to birth control and family planning | |
| C. an increase in the number of people living in poverty | |
| D. an increase in food production through improved agricultural practices |
Explanation
Infant mortality rate is measured as the number of infant (birth to age 1) deaths for every 1,000 live births. The infant mortality rate is a good indicator of a society's quality of life because it highlights a population's access to health services and nutrition.
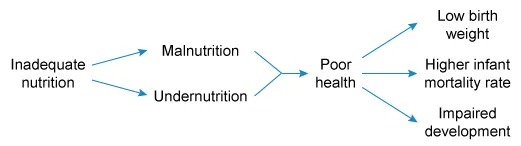
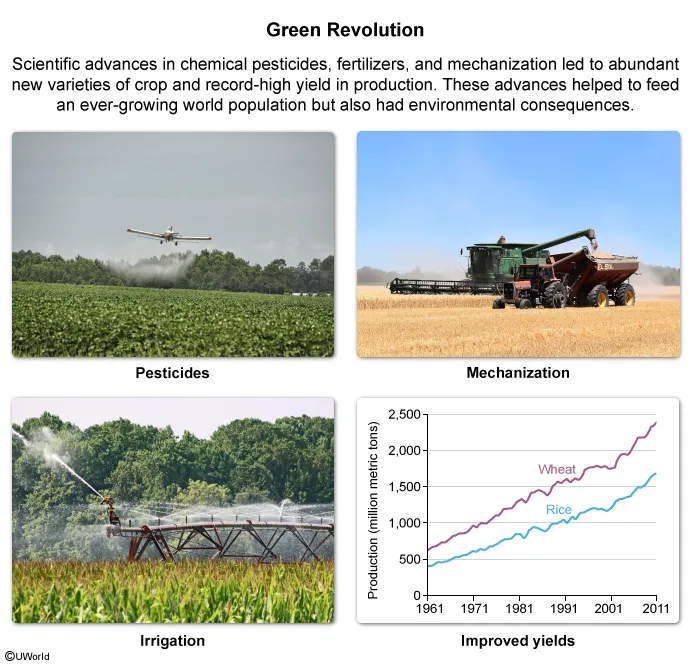
For both mothers and infants, access to quality health care and nutritious food helps prevent malnutrition (lacking nutrients in food), undernutrition (insufficient food), and other health issues. Improvements in agriculture, such as mechanization of tools and equipment, can reduce the cost of food production. These improvements increase the amount of nutritious food produced and distributed to a population.
Therefore, in addition to increased access to health care, Thailand's decreasing infant mortality rate was most likely caused by an increase in food production through improved agricultural practices.
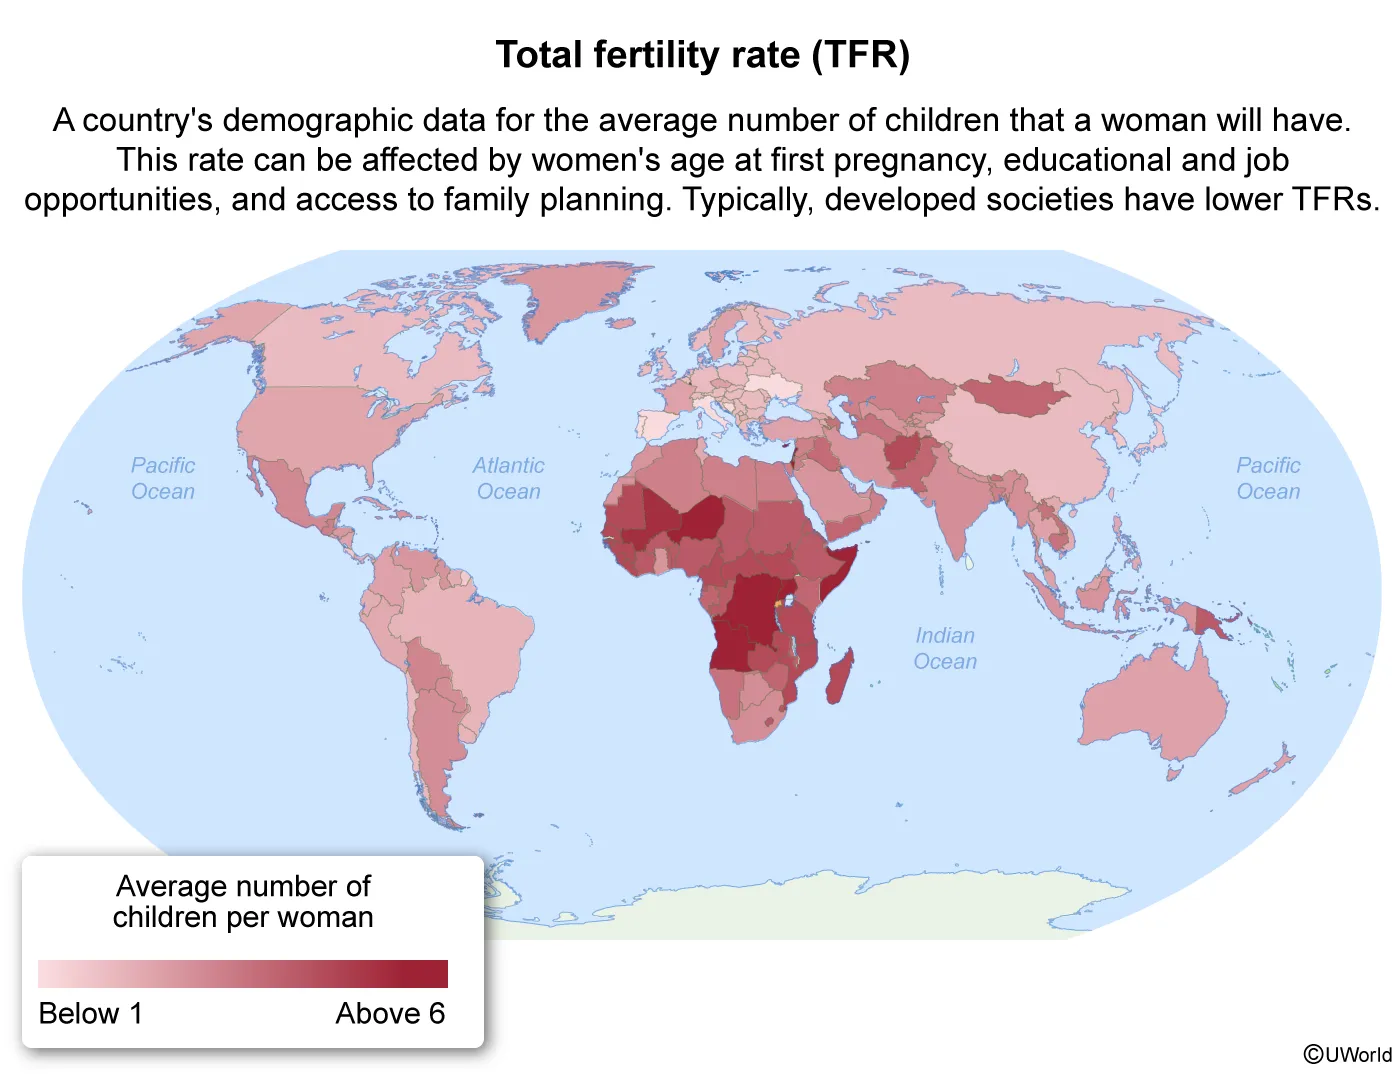
(Choice A) When women have fewer opportunities in the labor market, the total fertility rate increases, which is correlated with increased, not decreased, infant mortality rates.
(Choice B) As access to birth control and family planning decreases, infant mortality rates increase.
(Choice C) High levels of poverty indicate low access to health care and a lack of adequate nutrition, which increase, not decrease, the infant mortality rate.
Things to remember:
Infant mortality rates are measured by the number of infant deaths per 1,000 live births. As access to health care and adequate nutrition improves, the infant mortality rate decreases.
Question
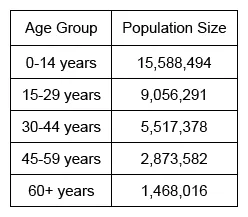
The table below shows the population sizes for various age groups in Angola in 2021.
Based on the population size for each age group, which of the following best describes Angola's population growth rate?
| A. Angola's population is rapidly growing. | |
| B. Angola's population is slowly growing. | |
| C. Angola's population is stable. | |
| D. Angola's population is declining. |
Explanation
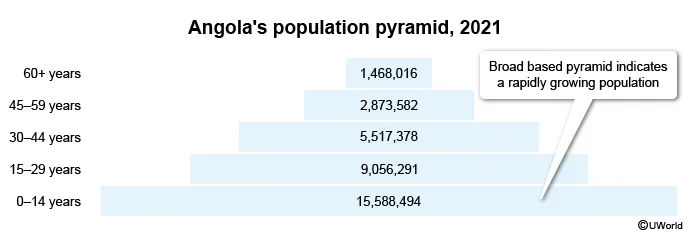
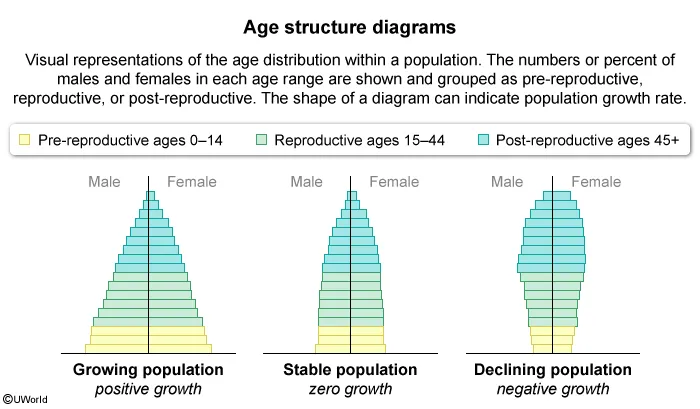
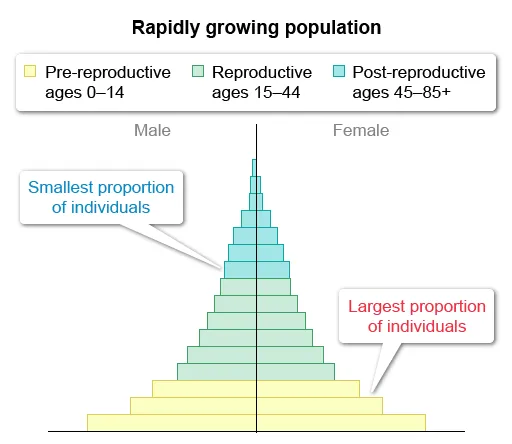
According to the table, Angola has a large number of pre-reproductive individuals (0–14 years old) and a smaller number of post-reproductive individuals (45+ years old). When the population sizes of these age groups are represented as a population pyramid, also known as an age structure diagram, Angola's population forms a broad-based pyramid shape.
Typically, this shape reflects a rapidly growing population because the large number of younger individuals suggests that birth rates are very high. Based on the data, Angola's population is rapidly growing.
(Choice B) Similarly to a rapidly growing population, a slowly growing population will have a larger number of pre-reproductive individuals compared with post-reproductive individuals; however, the population differences between the age groups would be slight, not extreme. The age groups represented in the table show that, beginning with the 0–14 group, the number of individuals in each age group is about half of the previous age group—an extreme difference.
(Choice C) Stable populations have approximately equal proportions of individuals in pre-reproductive and reproductive age groups rather than one age group being significantly larger or smaller than another.
(Choice D) Declining populations typically have a large proportion of post-reproductive, not pre-reproductive, individuals.
Things to remember:
Rapidly growing populations typically have a high proportion of pre-reproductive individuals (0–14 years old), unlike stable or declining populations.
Question
Population overshoot of an animal species is most likely to result in which of the following environmental problems?
| A. Genetic mutations | |
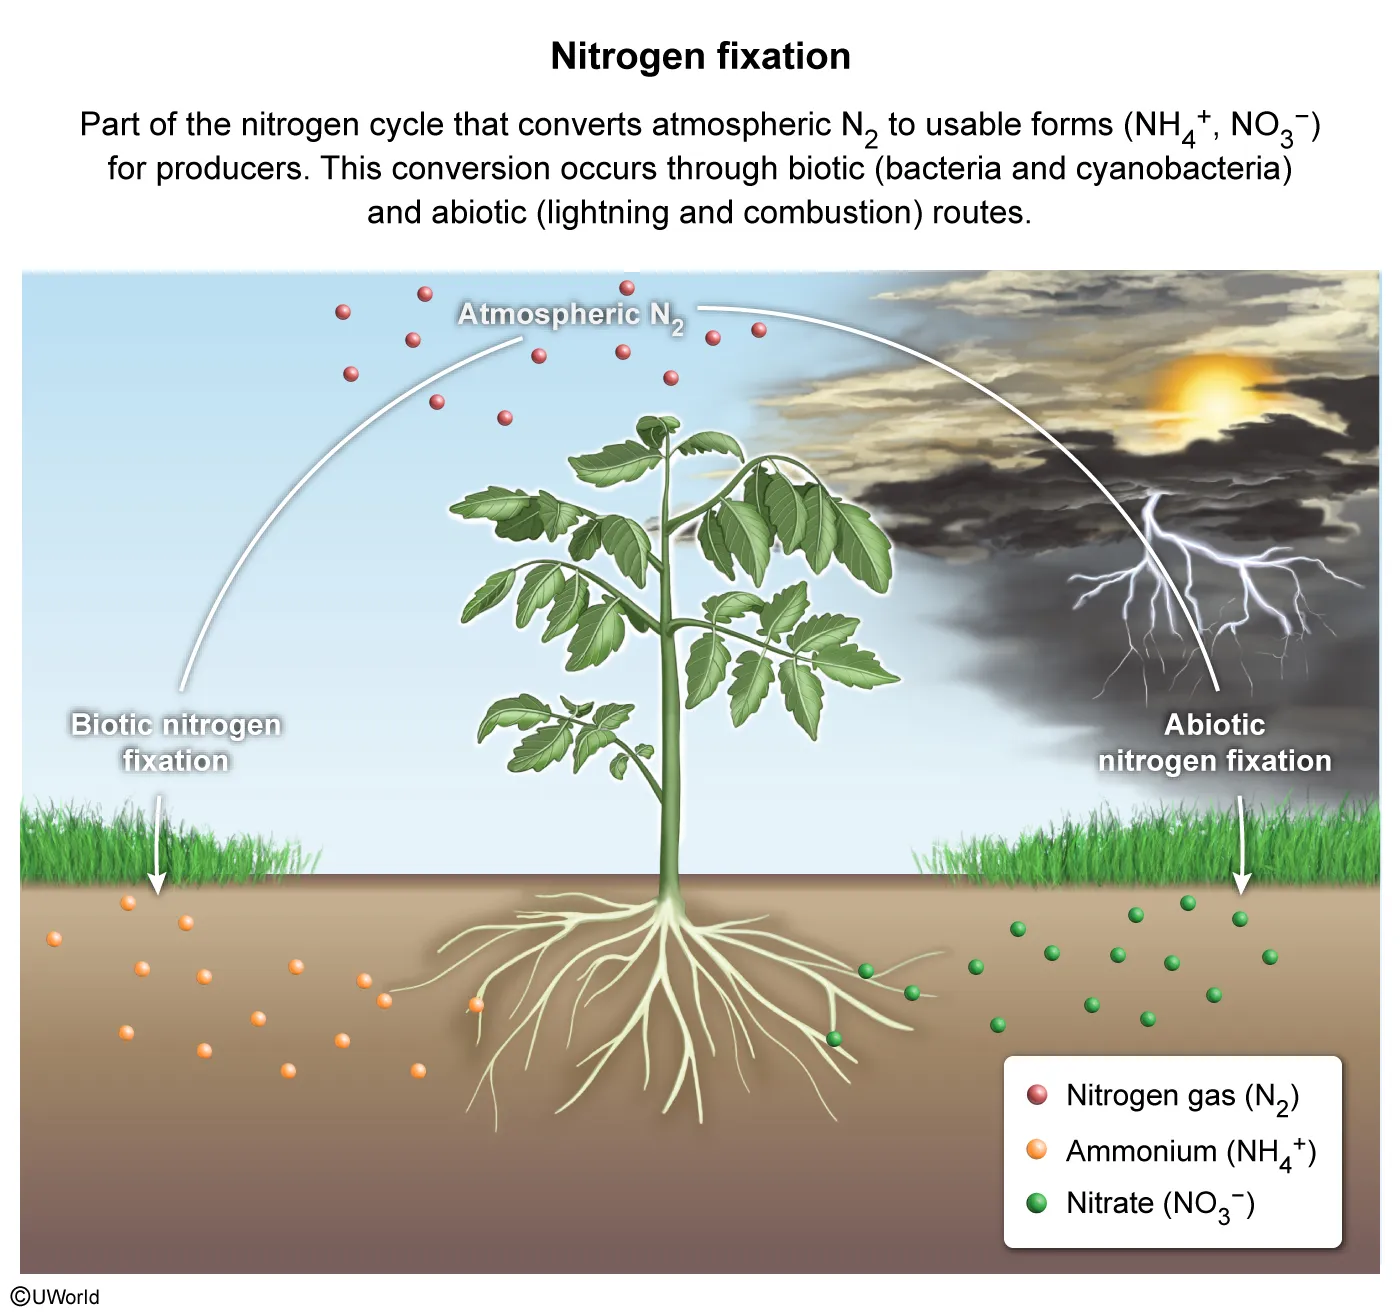
| B. Nitrogen fixation | |
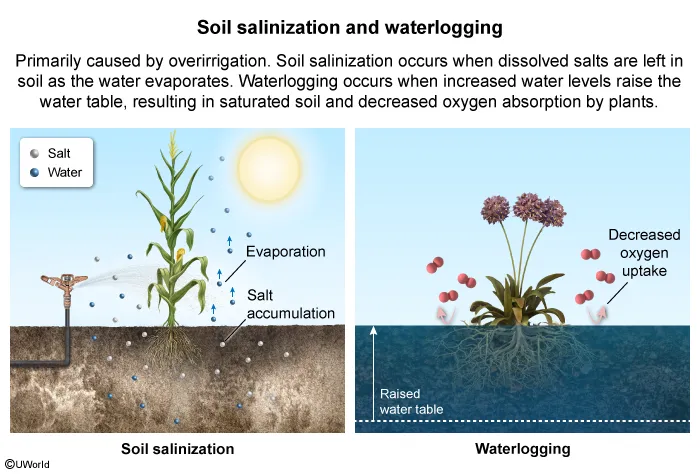
| C. Soil salinization | |
| D. Resource depletion |
Explanation
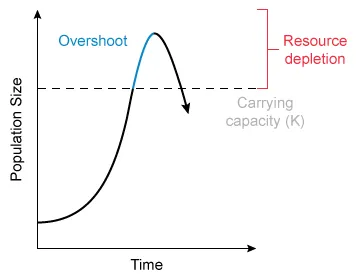
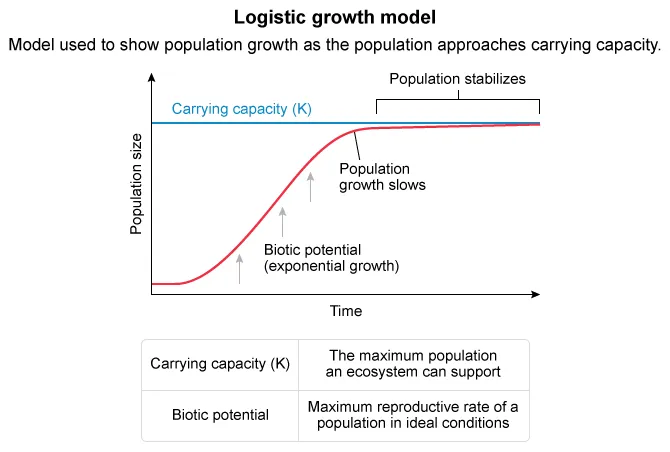
A species can experience a population overshoot when the number of organisms in an ecosystem exceeds the carrying capacity (K)—the largest population an ecosystem can sustain based on biotic and abiotic factors, such as the availability of resources. As the number of organisms in a population increases past K, the available resources are consumed at a rate faster than they can be replenished, resulting in the depletion of resources.
(Choice A) Although genetic mutations can occur during reproductive events, they are not a likely result of a population overshoot.
(Choice B)Nitrogen fixation is a natural process that increases nitrogen in the soil and does not result from population overshoot.
(Choice C) Although overpopulation may result in some degradation of the soil, soil salinization is not a likely result of population overshoot.
Things to remember:
Carrying capacity (K) is the largest population that can be sustained by an ecosystem. When populations exceed K, they experience an overshoot, which results in negative environmental impacts.
AP Environmental Science Practice Test: Earth Systems and Resources
Question
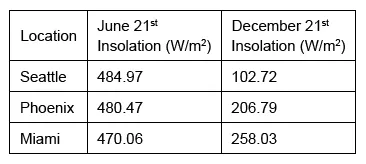
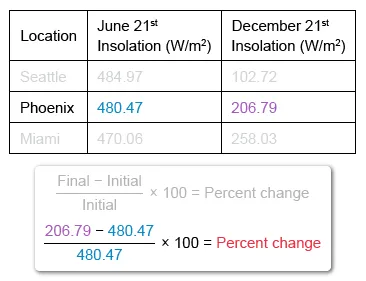
The table below shows the insolation for three United States cities on June 21st and December 21st of 2021.
Which of the following calculation methods would determine the percent change in insolation for Pheonix from June 21st to December 21st?
| A. | |
| B. | |
| C. | |
| D. |
Explanation
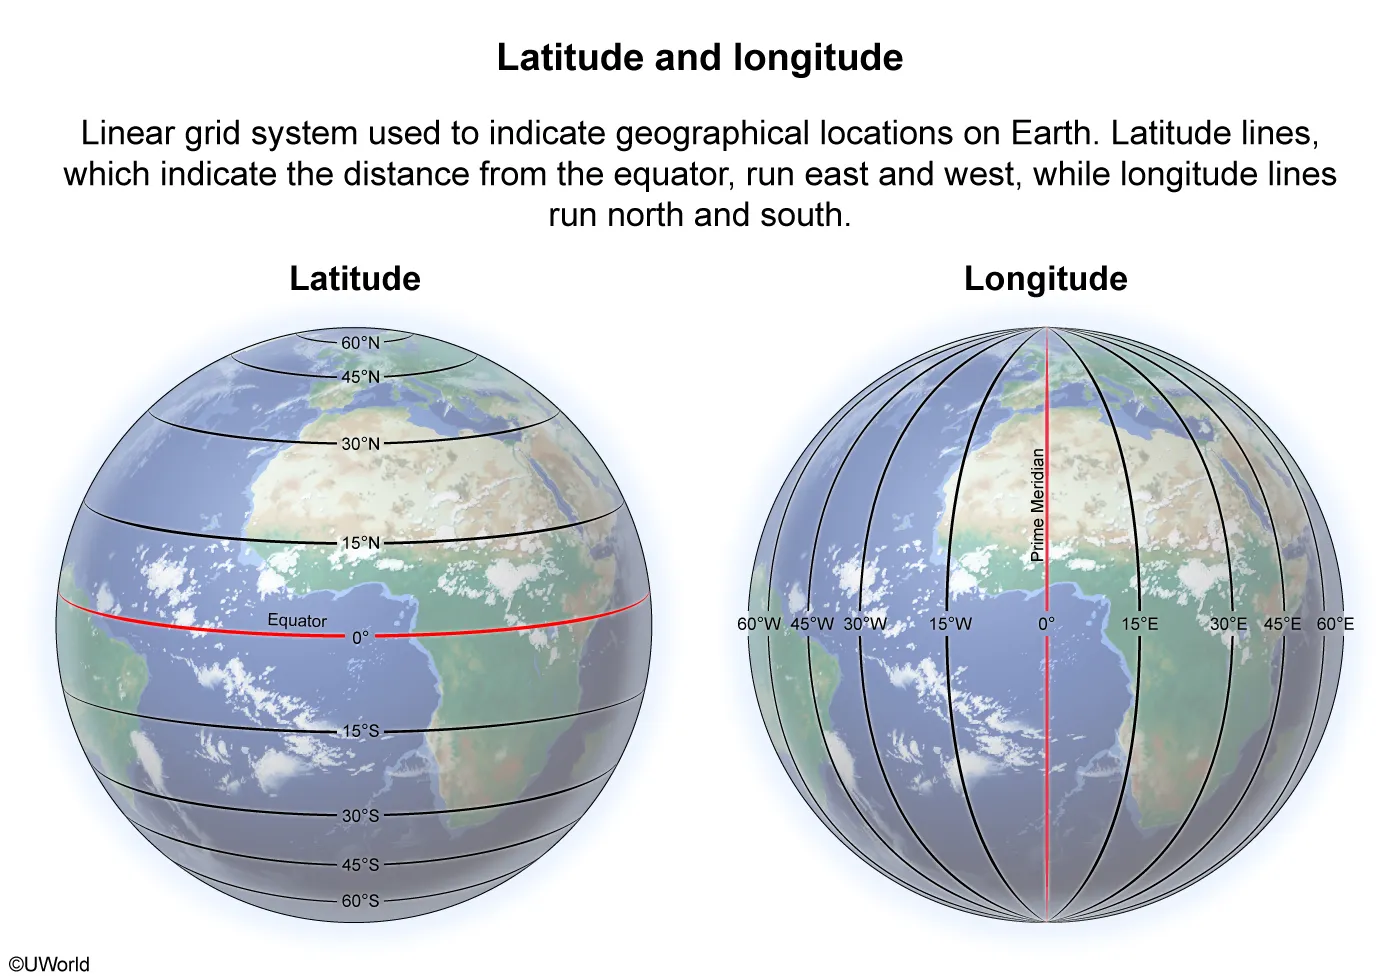
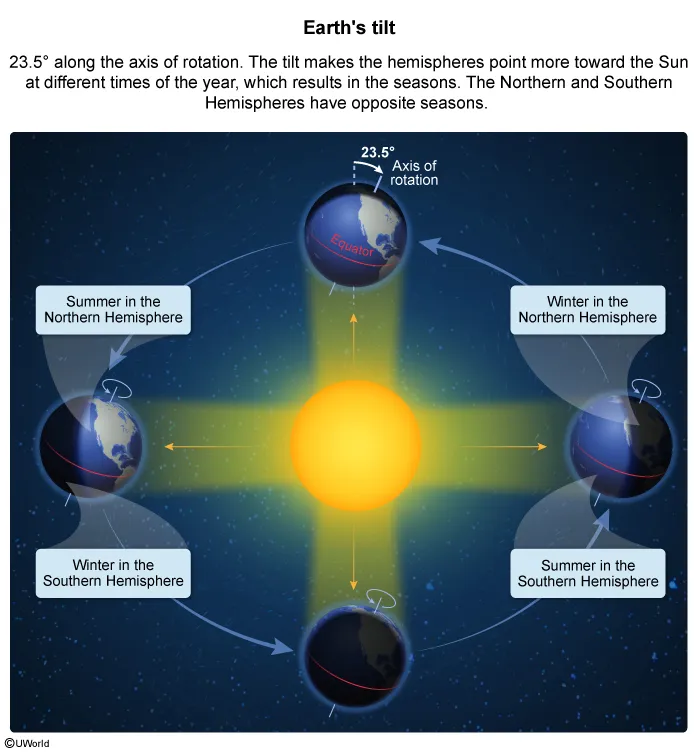
Insolation (incoming solar radiation) is the energy from the Sun that reaches Earth's surface and is the Earth's main source of energy. Because of Earth's shape and tilt on its axis of rotation, the amount of insolation a location receives varies by latitude and season.
For example, the amount of insolation Phoenix receives is different during the summer than in the winter. The biggest variation in insolation is between its summer solstice (June 21st), when the Northern Hemisphere is tilted toward the Sun, and its winter solstice (December 21st), when the Northern Hemisphere is tilted away from the Sun. The percent change in Phoenix's insolation is:
(Choice A) may result from mistakenly using the incorrect formula may result from mistakenly using the incorrect formula instead of using the percent change formula instead of using the percent change formula
(Choice B) may result from mistakenly dividing the final value by the initial value instead of using the percent change formula .
(Choice D) may result from mistakenly using the incorrect formula instead of using the percent change formula instead of using the percent change formula
Things to remember:
Insolation (incoming solar radiation) is Earth's main source of energy. Because of Earth's curvature and tilt on its axis of rotation, the amount of insolation that a location receives depends primarily on its latitude and season.
Question
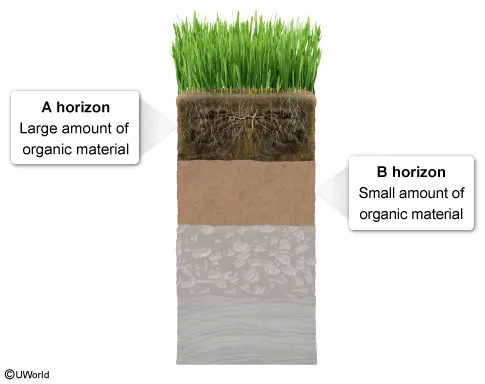
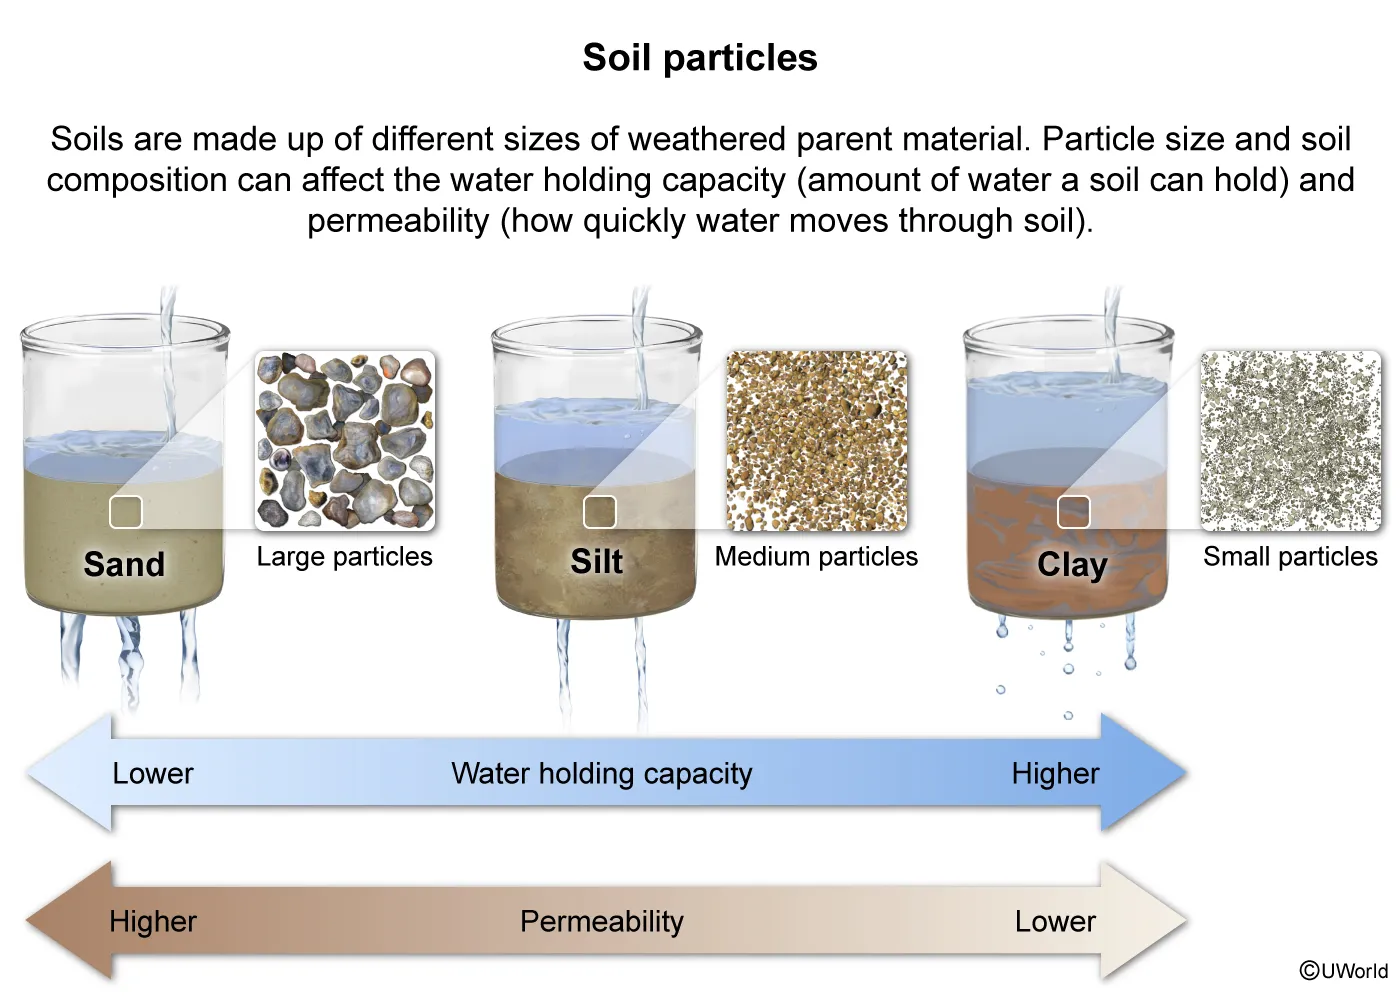
Which of the following best explains why an ecosystem would have more plant roots in the A horizon than in the B horizon of soil?
| A. The humus is less dense in the A horizon than in the B horizon, leading to lower acidity in the A horizon. | |
| B. The topsoil has the highest percentage of clay, so the A horizon retains more water than the B horizon. | |
| C. The A horizon has more organic material than the B horizon, so the A horizon has more microbial activity that increases nutrient cycling. | |
| D. The surface of soil has more weathered rock, leading to more waterlogging in the A horizon than in the B horizon. |
Explanation
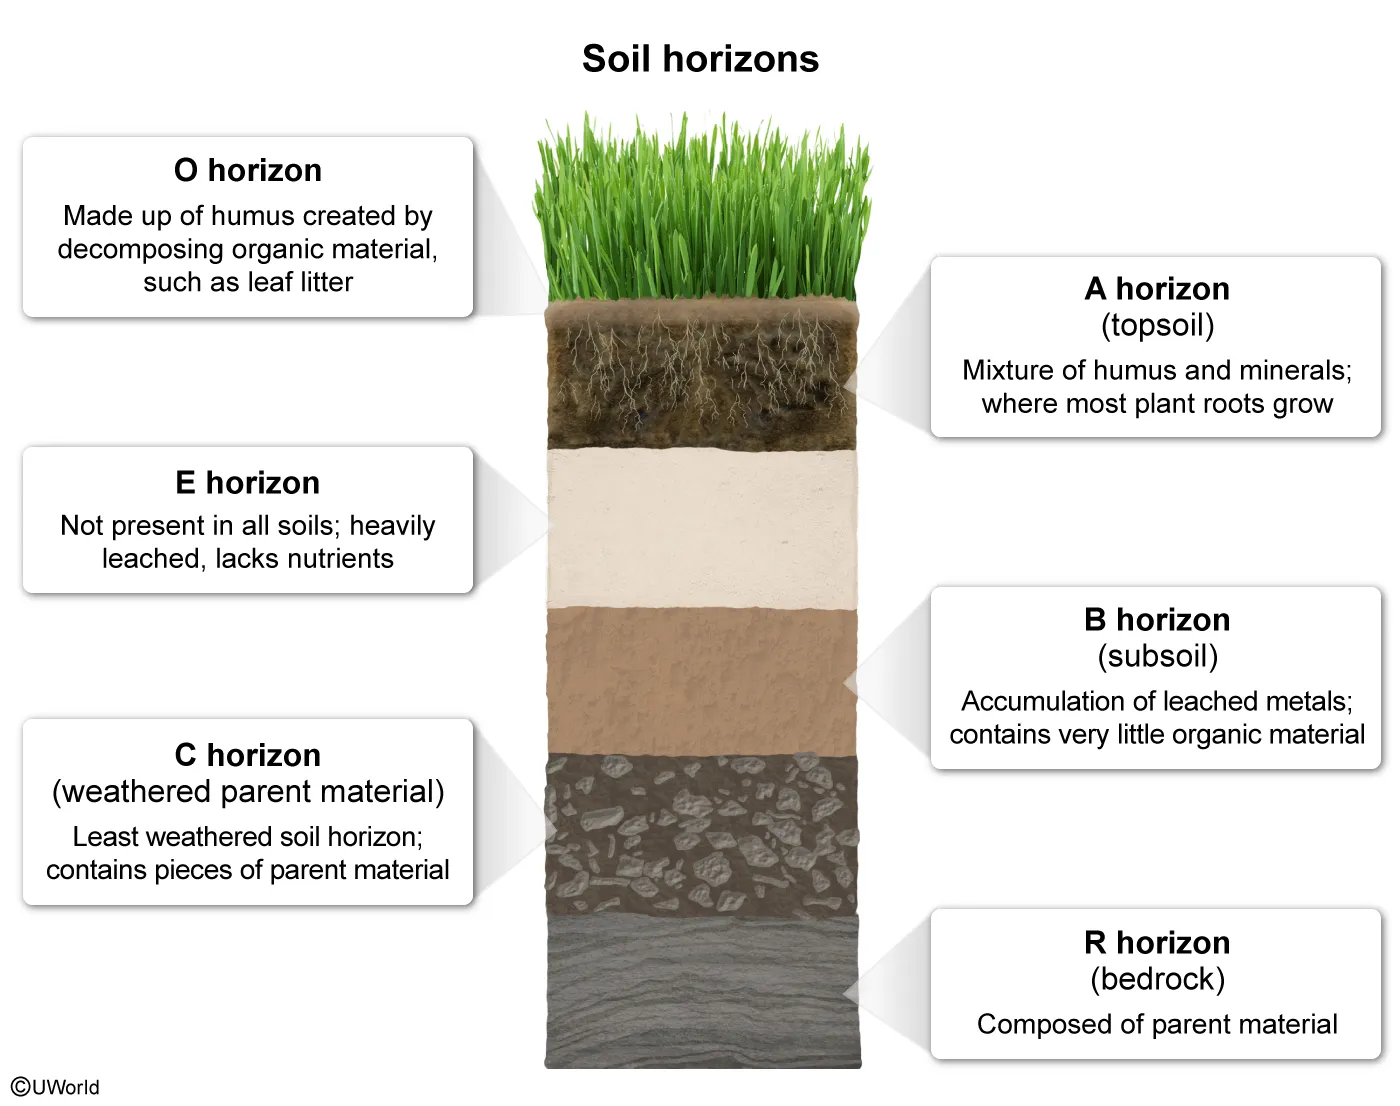
Soil horizons are layers of soil with varying compositions of minerals and organic material. Soil horizons closer to the:
- surface—O and A horizons—have a high percentage of organic material.
- bedrock—C and B horizons—have a high percentage of mineral material.
Because the A horizon has a higher amount of organic material than the B horizon, nutrient cycling increases as microbes, such as bacteria, decompose organic material. Because plants assimilate nutrients through their roots, more roots can be found in the A horizon compared with the B horizon.
(Choice A) Humus (organic material) is more, not less, dense in the A horizon than in the B horizon.
(Choice B) The topsoil, which includes the A horizon, has the highest percentage of organic material, not clay particles.
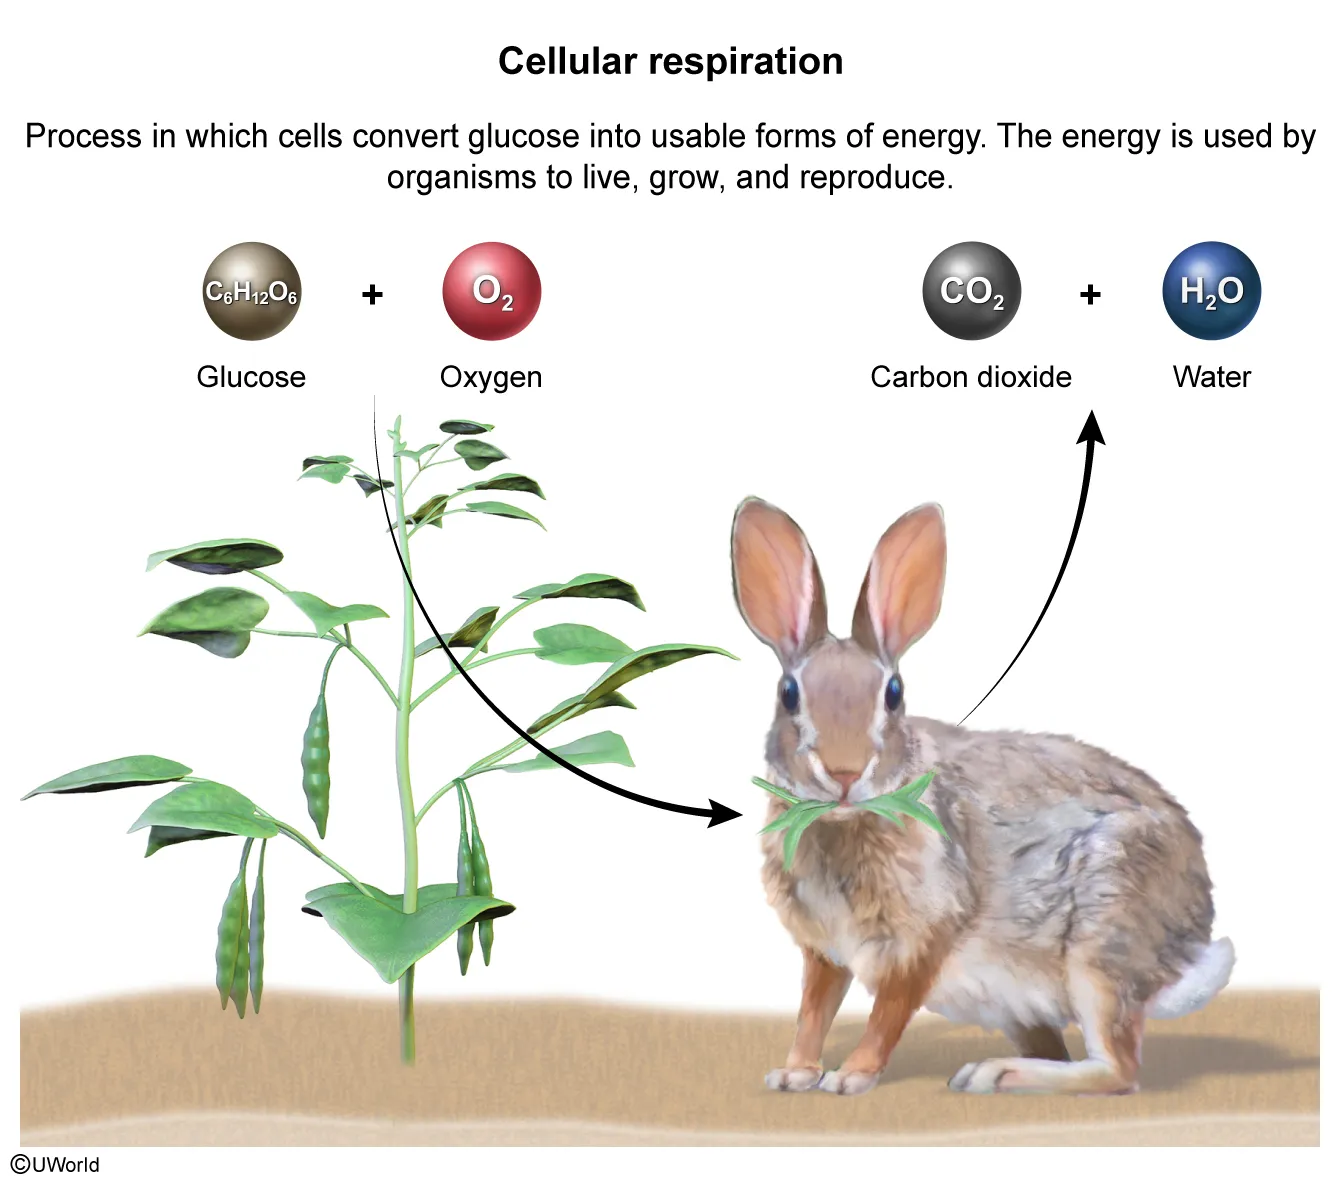
(Choice D) Because waterlogging decreases the amount of oxygen available to plant roots for cellular respiration, more plant roots would grow in a soil horizon with less, not more, waterlogging.
Things to remember:
Soil is made up of horizons that contain varying compositions of minerals and organic material.
Question
Which of the following best describes why soil formation occurs over long periods of time?
| A. The processes of magma surfacing and solidifying into soil particles are infrequent. | |
| B. The process of gravity compacting Earth's crust into soil particles is weak. | |
| C. The process of geologic uplift to expose soil particles takes millions of years. | |
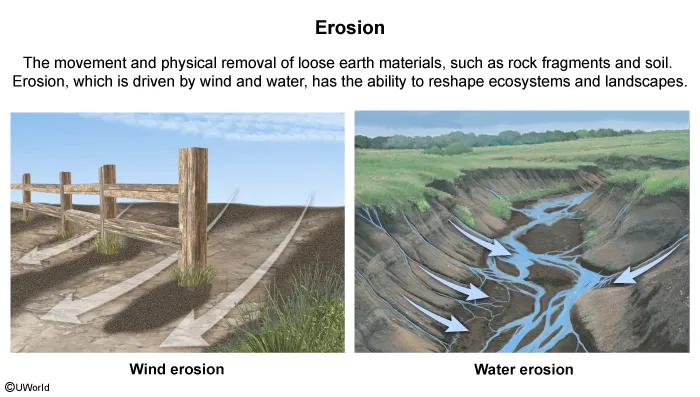
| D. The processes of weathering and erosion to deposit soil particles are slow. |
Explanation
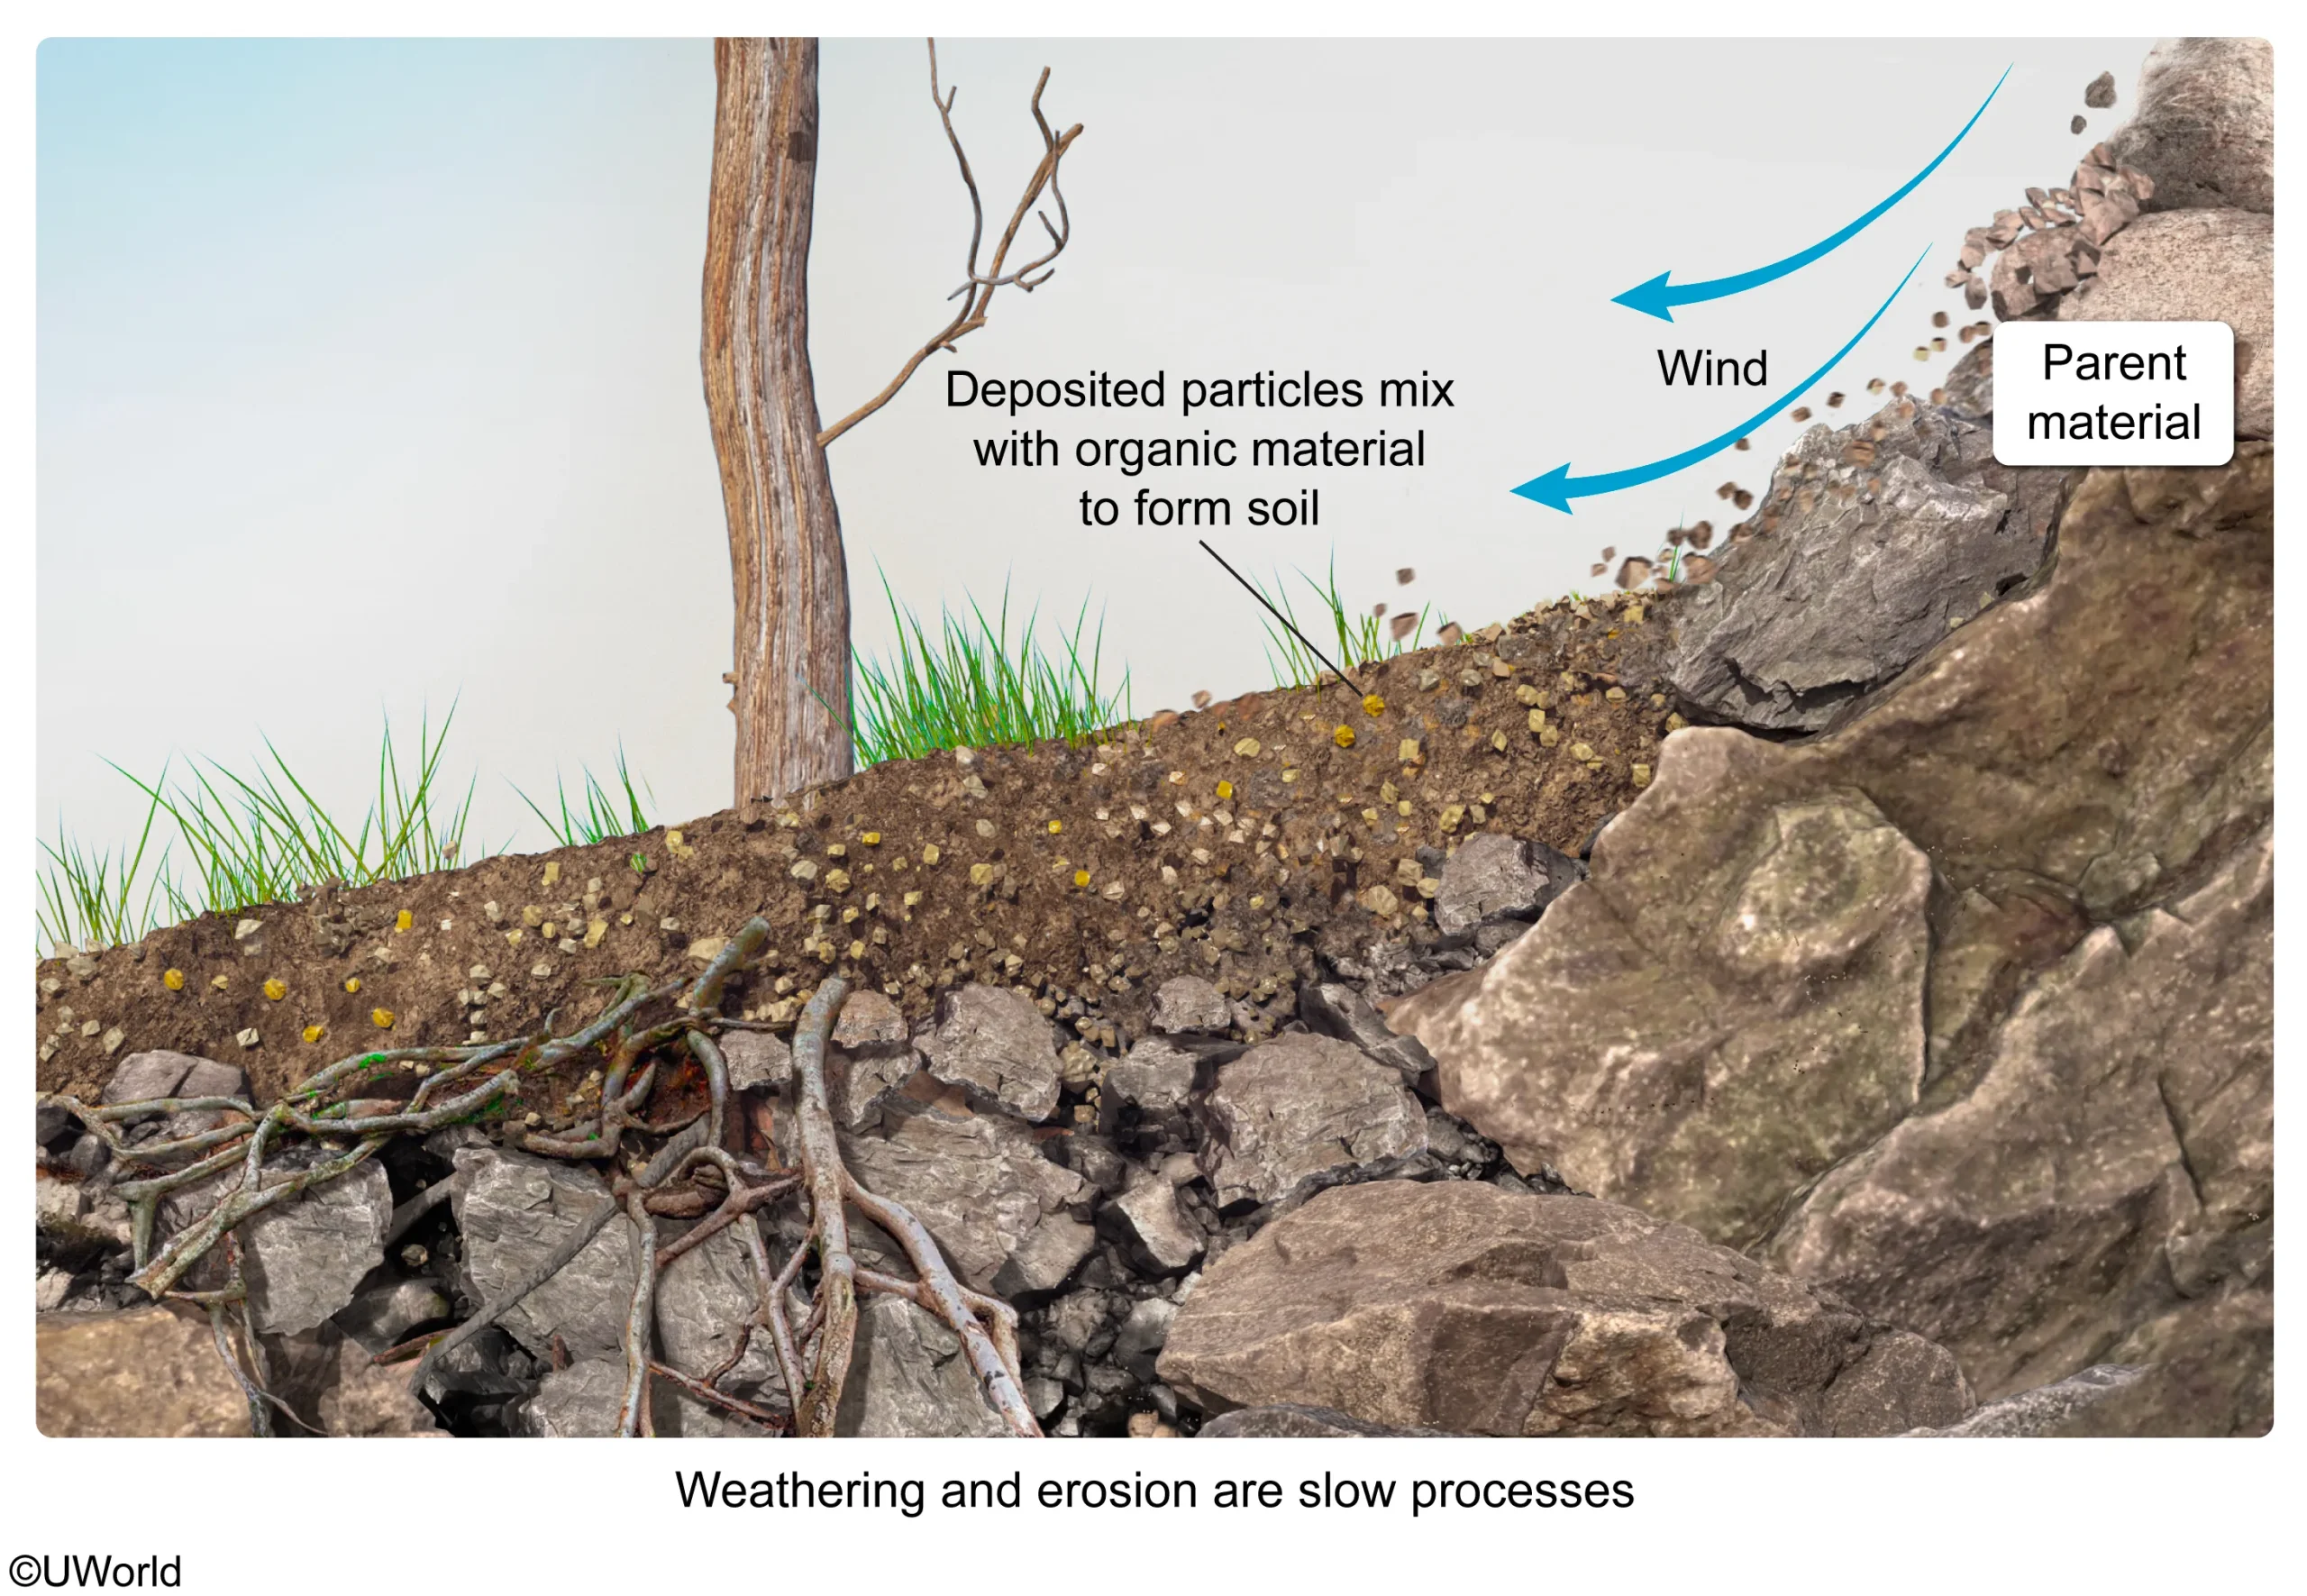
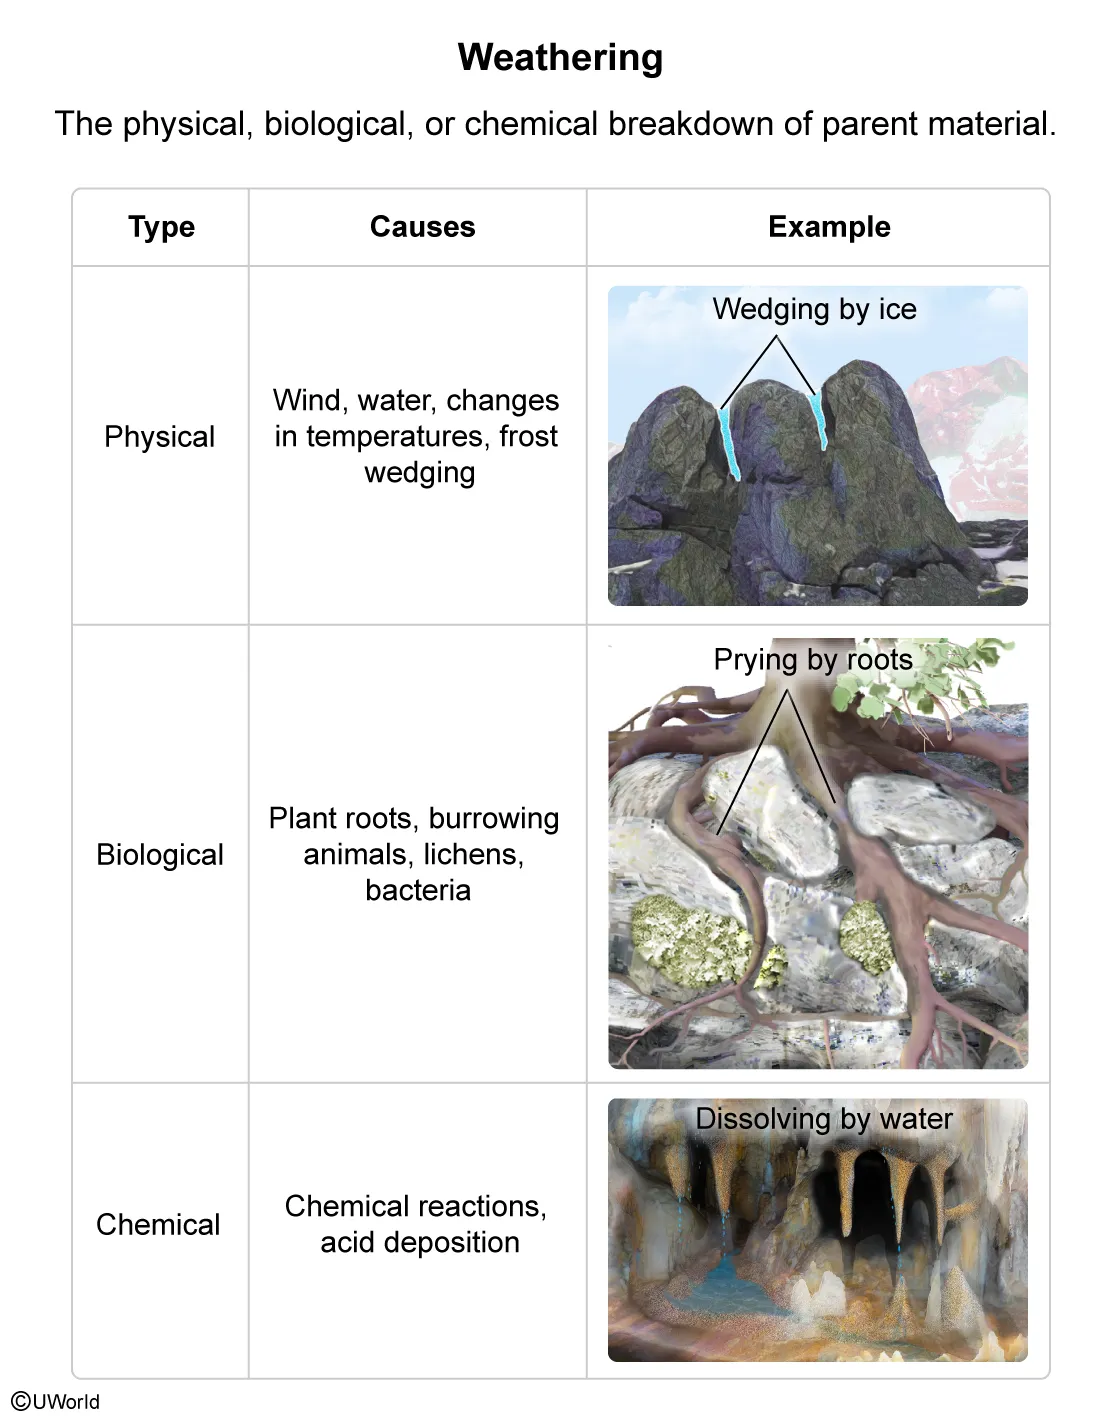
Soil is a mixture of minerals, organic material, water, and air that supports living organisms. The minerals in soil come primarily from the weathering of parent material, or bedrock. Weathering breaks down the parent material into smaller particles, which are then easily eroded, or transported to new locations. Once deposited, the particles mix with organic material to form soil.
However, the process of weathering takes a long time, and erosion to deposit soil particles is slow, so soil formation occurs over long periods of time. For example, it is estimated to take about 500–1,000 years to form one inch of soil.
(Choice A) When magma rises to Earth's surface, it solidifies into parent material, not soil particles.
(Choice B) The compaction of Earth's crust reduces empty space to form rock, not soil particles, over time.
(Choice C) Geologic uplift is the process of Earth's surface rising to form mountains and other landforms, which exposes rock, not soil particles, to atmospheric conditions.
Things to remember:
Over long periods of time, the parent material of soil is weathered into smaller particles, eroded by wind and water, and deposited and mixed with organic material, water, and air to form soil.
AP Environmental Science Practice Test: Land and Water Use
Question
The graph below shows the number of irrigation wells in four Oklahoma counties overlying the Ogallala Aquifer from 1945 to 2015.
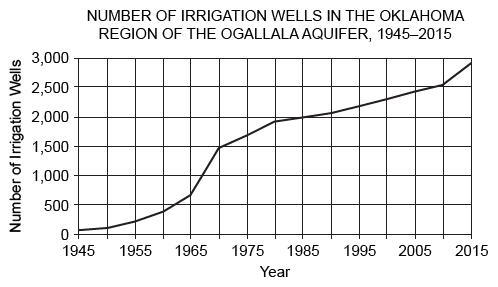
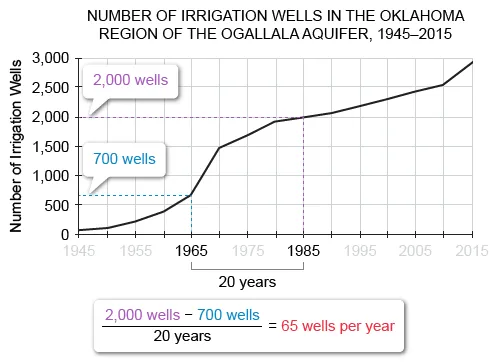
Based on the data in the graph, which of the following is closest to the average irrigation well installation rate from 1965 to 1985?
| A. 1,300 wells per year | |
| B. 700 wells per year | |
| C.65 wells per year | |
| D. 43 wells per year |
Explanation
The Ogallala Aquifer is an underground source of water in the central US. This area of the US, which consists of agricultural fields and ranches, has come to rely on the aquifer for irrigation of crops. Because of the reliance on water from this source, many irrigation wells have been drilled into the Ogallala Aquifer and have drawn water from the aquifer quicker than it can be recharged, which has led to the aquifer becoming depleted.
As shown in the graph, the use of irrigation wells in Oklahoma overlying the Ogallala Aquifer has increased significantly since 1945. For example, the number of wells in Oklahoma increased from about 700 in 1965 to about 2,000 in 1985, resulting in an average installation rate of approximately 65 wells per year.
(Choice A) 1,300 is the difference in the number of irrigation wells from 1965 to 1985. However, to find the rate of installation per year, this value should be divided by 20 years.
(Choice B) 700 is the number of wells in 1965, instead of the rate of installation.
(Choice D) 43 wells per year is the approximate rate of installation from 1945 to 2015, instead of 1965 to 1985.
Things to remember:
The Ogallala Aquifer, located in the central US, has become depleted due to excessive use of groundwater to irrigate agricultural lands.
Question
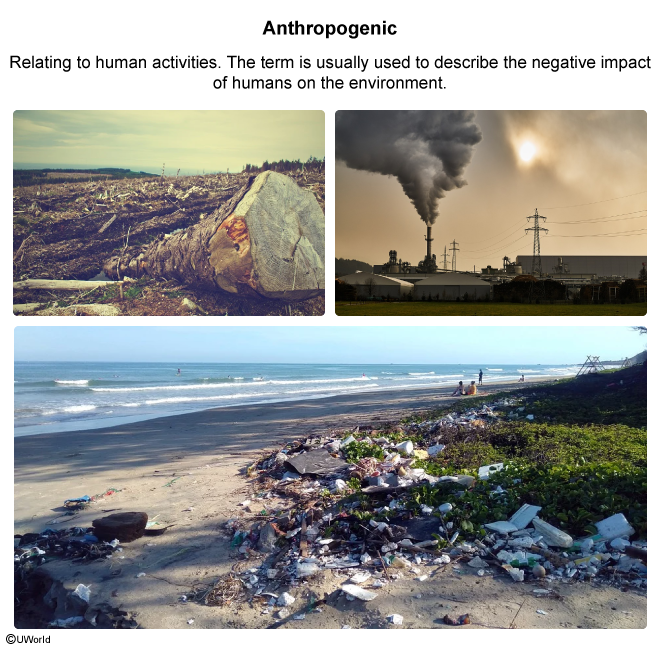
Which of the following anthropogenic activities is correctly paired with its waste product?
| A. Natural gas combustion and methane | |
| B. Agriculture and chlorofluorocarbons | |
| C.Deforestation and acid deposition | |
| D. Mining ore and tailings |
Explanation
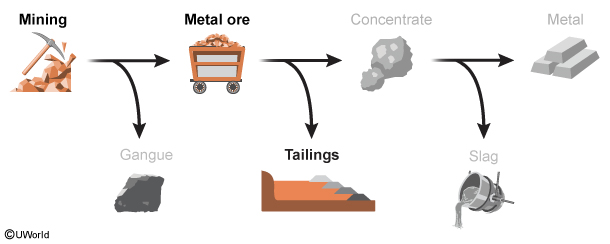
Mining is an anthropogenic process used to extract natural resources, such as coal and metallic ore, from underground deposits. Waste products of the mining process include:
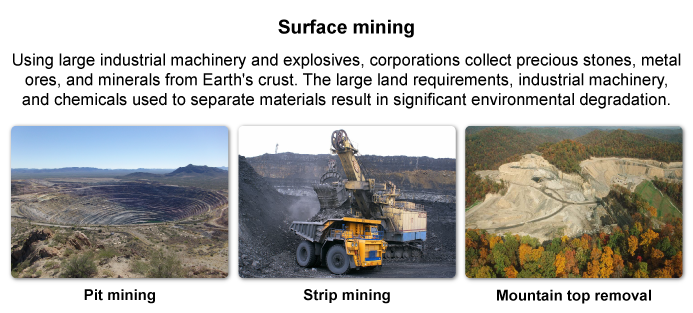
-
overburden (soil and rocks that are removed to gain access to the deposits).
-
slag and tailings that are removed from the ore when it is processed.
Although mining extracts materials used to produce energy and make consumer products, the process can fragment habitats, contaminate groundwater, and release methane.
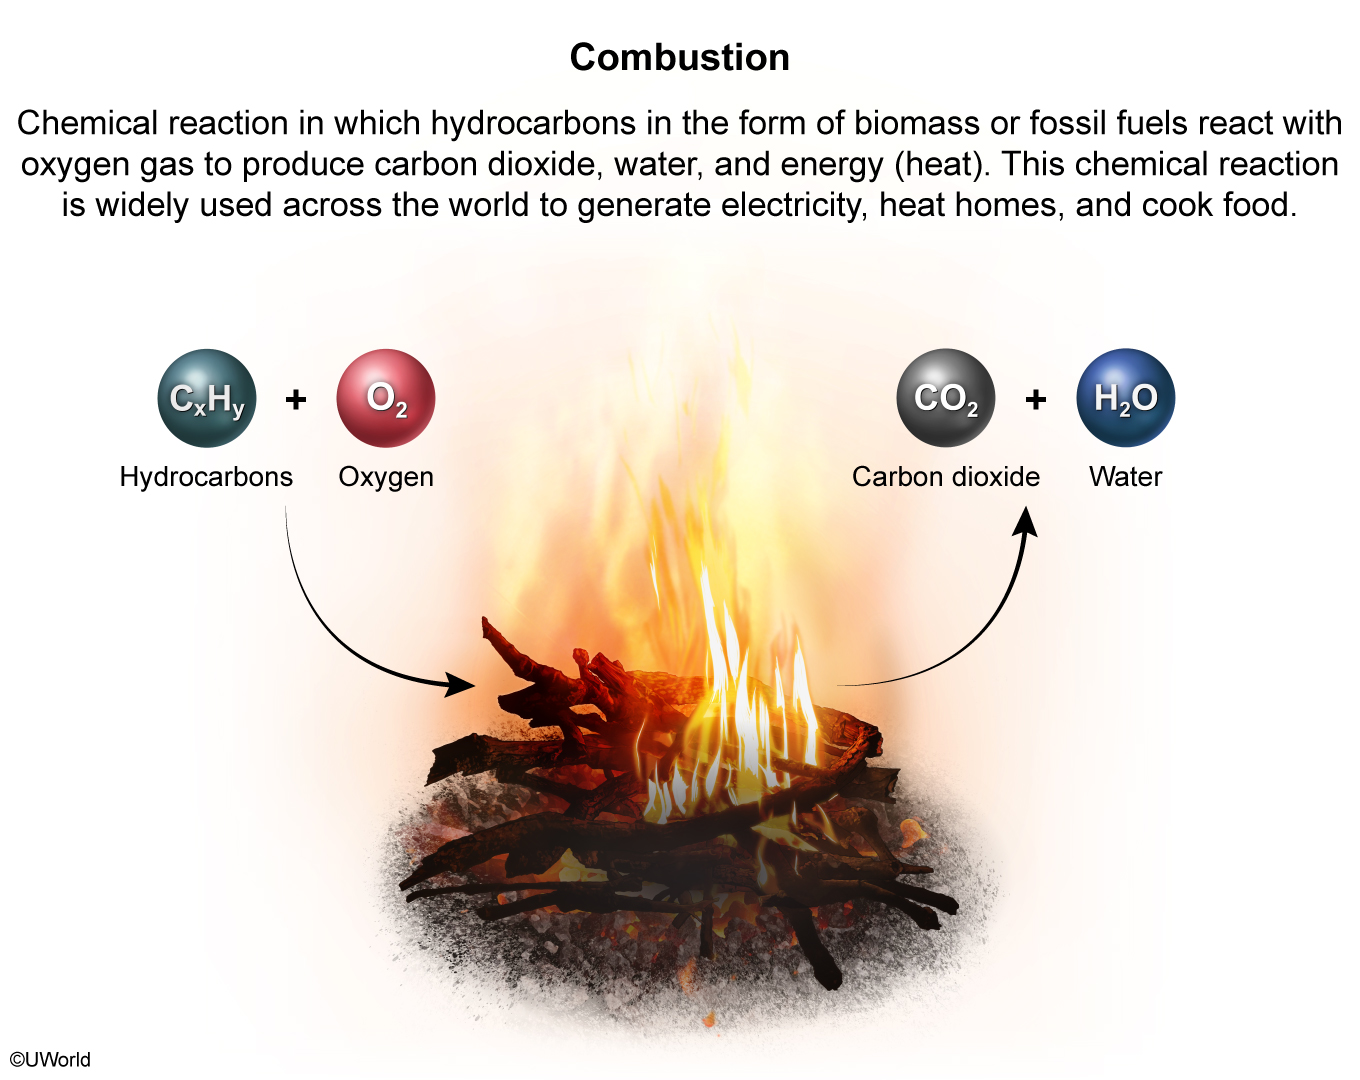
(Choice A) Although the extraction of natural gas can release methane into the atmosphere, the combustion of natural gas emits carbon dioxide and water, not methane.
(Choice B) Chlorofluorocarbons (CFCs) are typically used for refrigeration and cooling, not agriculture.
(Choice C) Acid deposition results from burning fossil fuels, such as at coal-burning power plants, not from deforestation.
Things to remember:
Mining is used to extract natural resources from underground
deposits, but the process generates byproducts called slag and tailings. Mining can also fragment
habitats, contaminate groundwater, and release methane.
Question
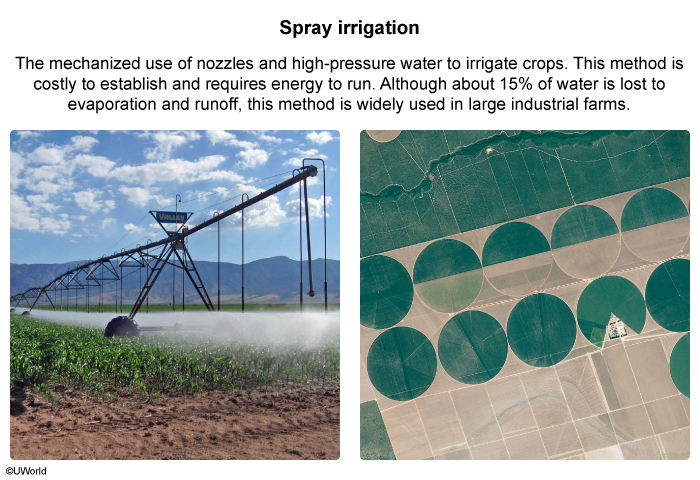
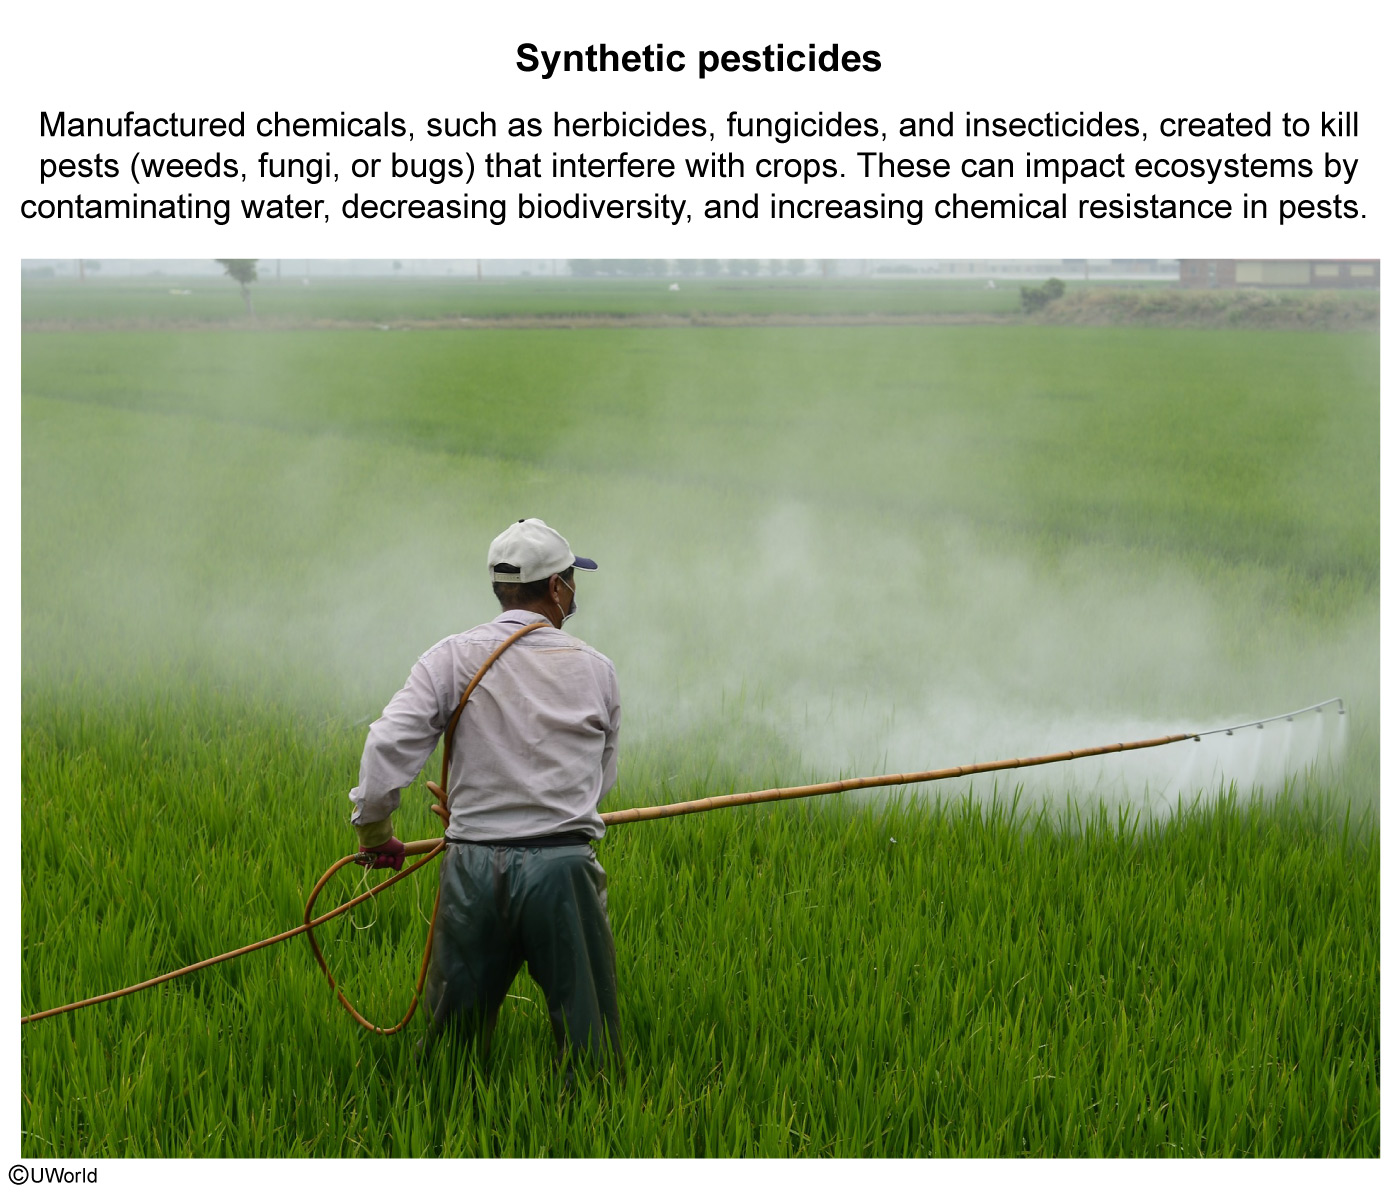
Which of the following best describes an advantage of using integrated pest management (IPM) over the heavy use of synthetic pesticides?
| A. IPM can minimize threats to human health. | |
| B. IPM requires less time and energy to eliminate pests. | |
| C.IPM is less expensive to implement. | |
| D. IPM provides more nutrients to growing crops. |
Explanation

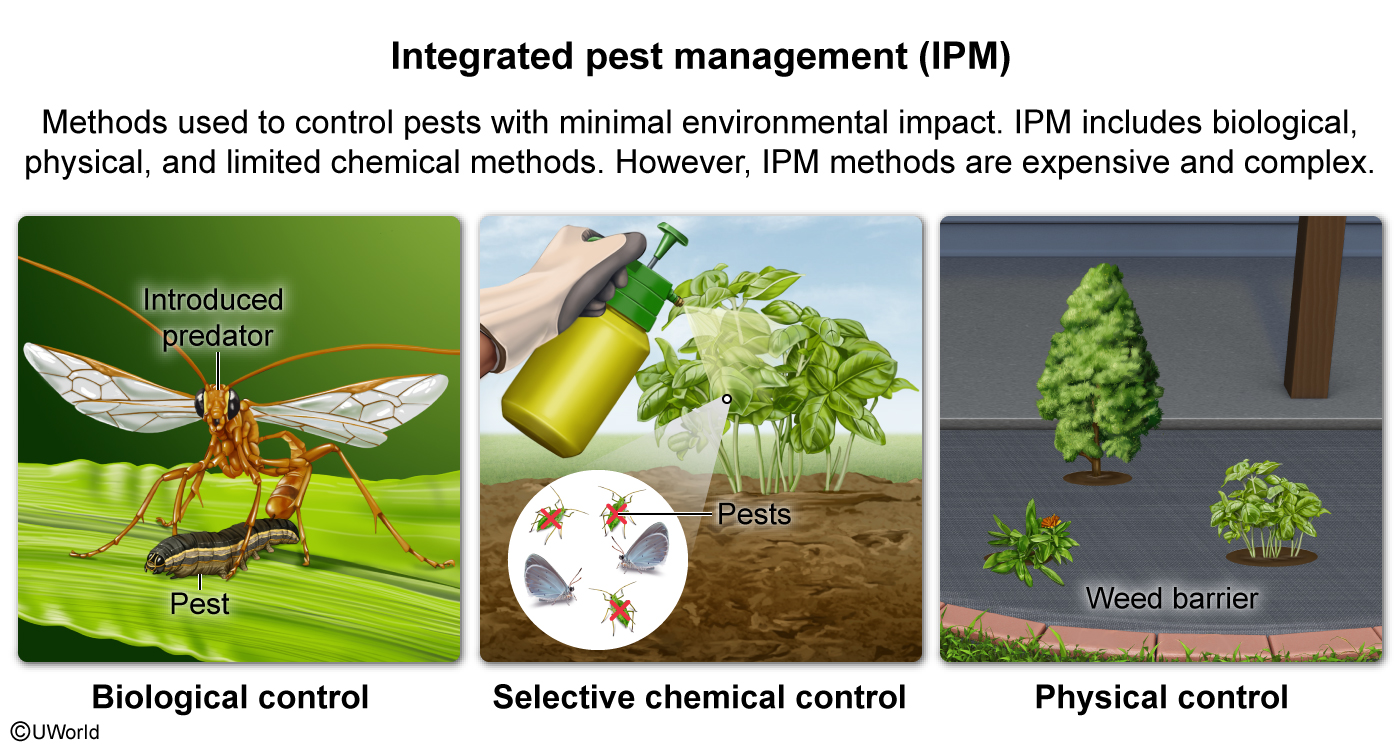
Integrated pest management (IPM) uses biological, mechanical, and limited chemical treatments to reduce the number of pests while minimizing environmental impacts. In the effective use of IPM, crops must be frequently inspected for pests and monitored throughout the treatments, increasing the cost of labor. In addition, the tools and machinery needed to implement the treatments require an up-front cost.
Because of its complexity, IPM is time intensive as well as expensive. However, because it decreases the heavy use of potentially toxic synthetic pesticides, IPM reduces environmental impacts and can minimize threats to human health.
(Choice B) To reduce the number of pests, IPM methods take more, not less, time and energy than applying synthetic pesticides.
(Choice C) Generally, IPM is more, not less, expensive to implement than heavy pesticides because it is more complex and time consuming.
(Choice D) IPM reduces the number of pests through biological, mechanical, and limited chemical methods; it does not provide more nutrients to crops.
Things to remember:
Integrated pest management (IPM) uses biological, mechanical, and
chemical methods to reduce the number of pests. Although IPM can be complex and expensive, it can
minimize environmental impacts and threats to human health.
AP Environmental Science Practice Test: Energy Resources and Consumption
Passage

Question
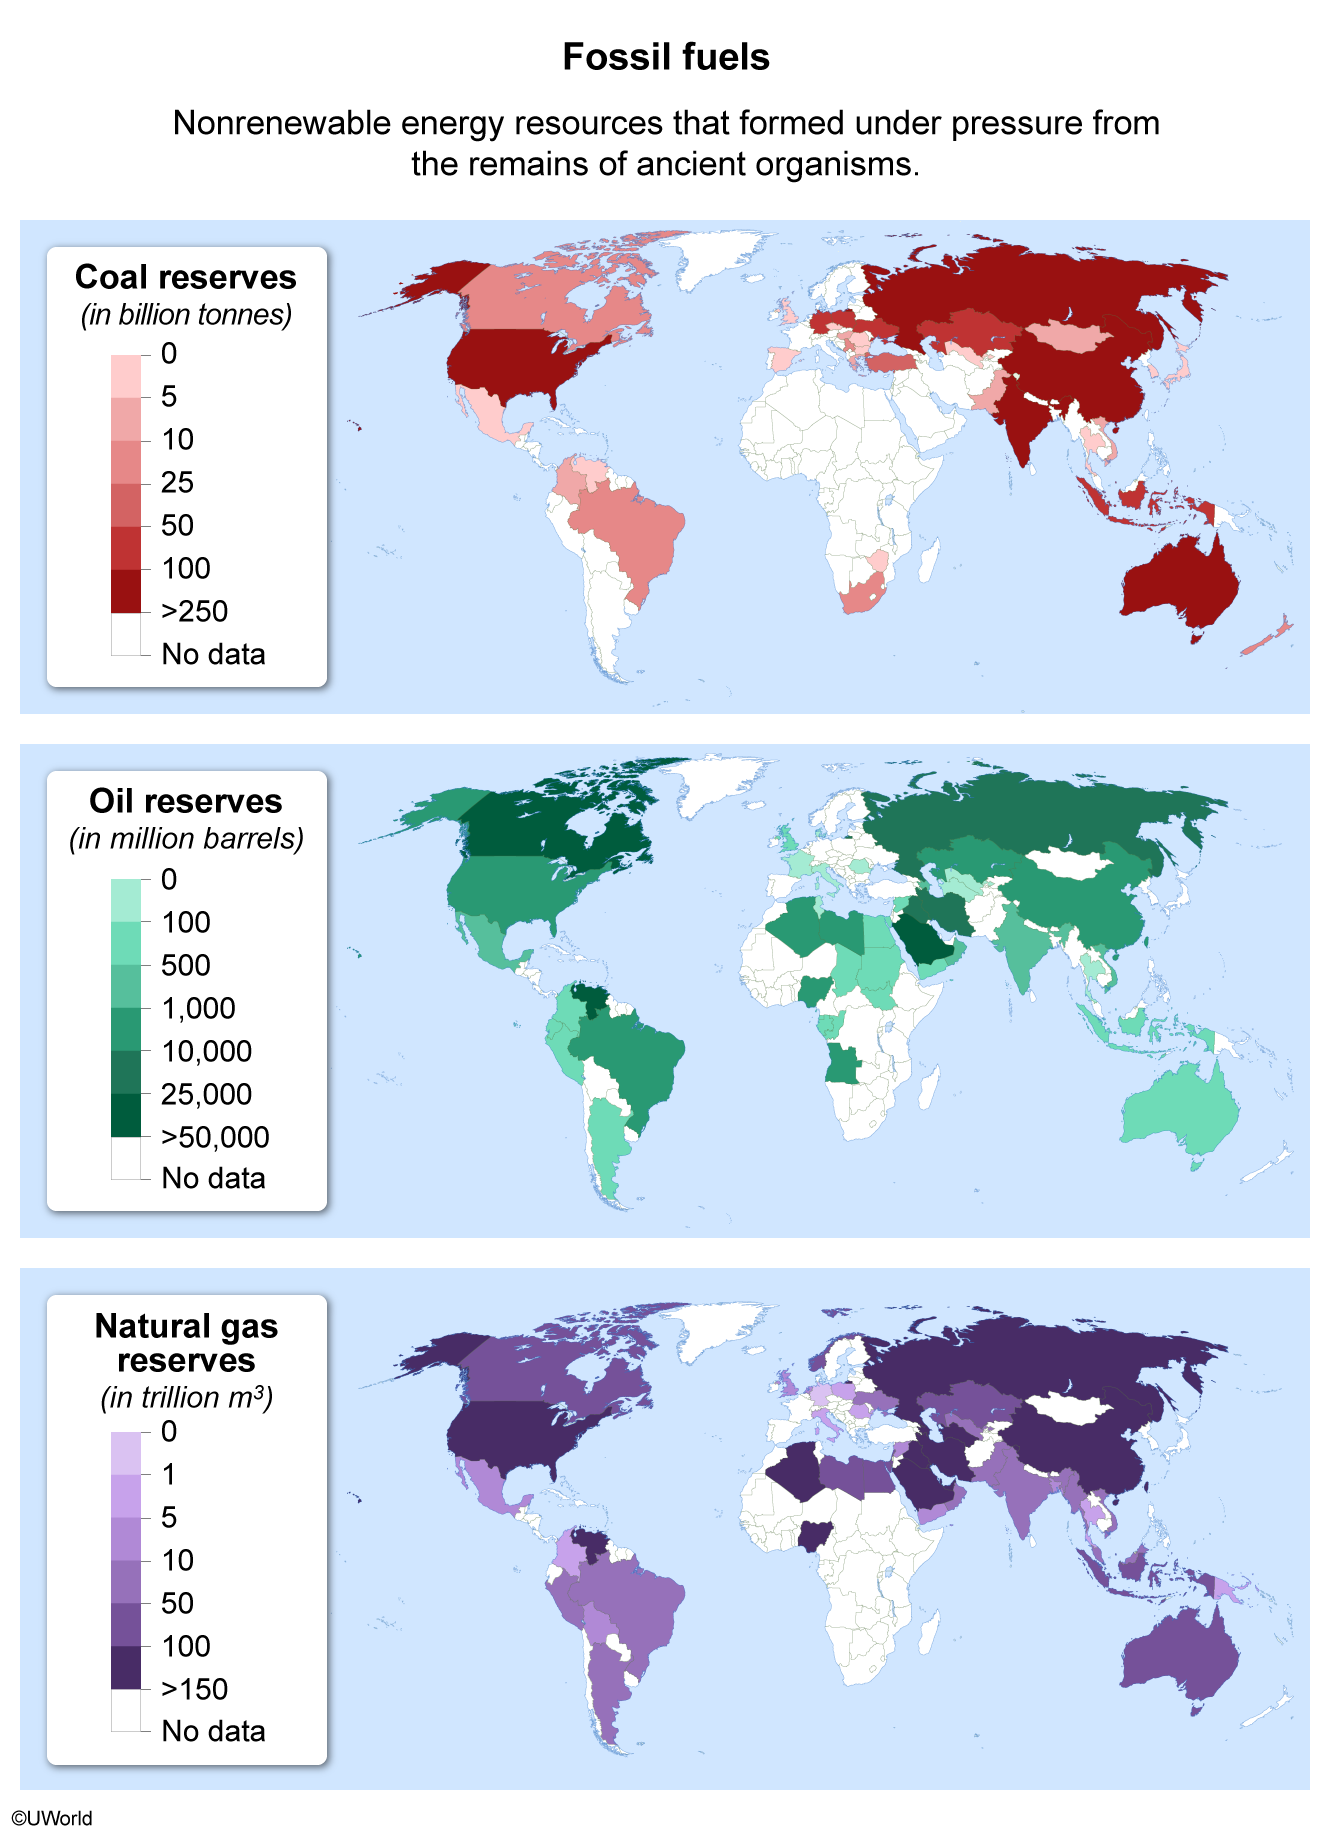
The area that has the largest natural gas deposits.
| A. A | |
| B. B | |
| C. C | |
| D. D |
Explanation

Natural gas, a fossil fuel primarily made up of methane—a greenhouse gas—is widely used as an energy resource. The gas is usually found in large underground deposits with petroleum or in small deposits between layers of shale rock.
Although natural gas is readily found around the world, the largest deposits are in northern Asia (Choice C).
(Choice A) The US is the largest exporter of natural gas, but the world's largest deposits of natural gas are not found in Florida.
(Choices B and D) These areas contain deposits of natural gas but not the world's largest.
Things to remember:
Natural gas is an energy resource found around the world. Due to its
geological makeup, northern Asia has the largest deposits of natural gas.
Question
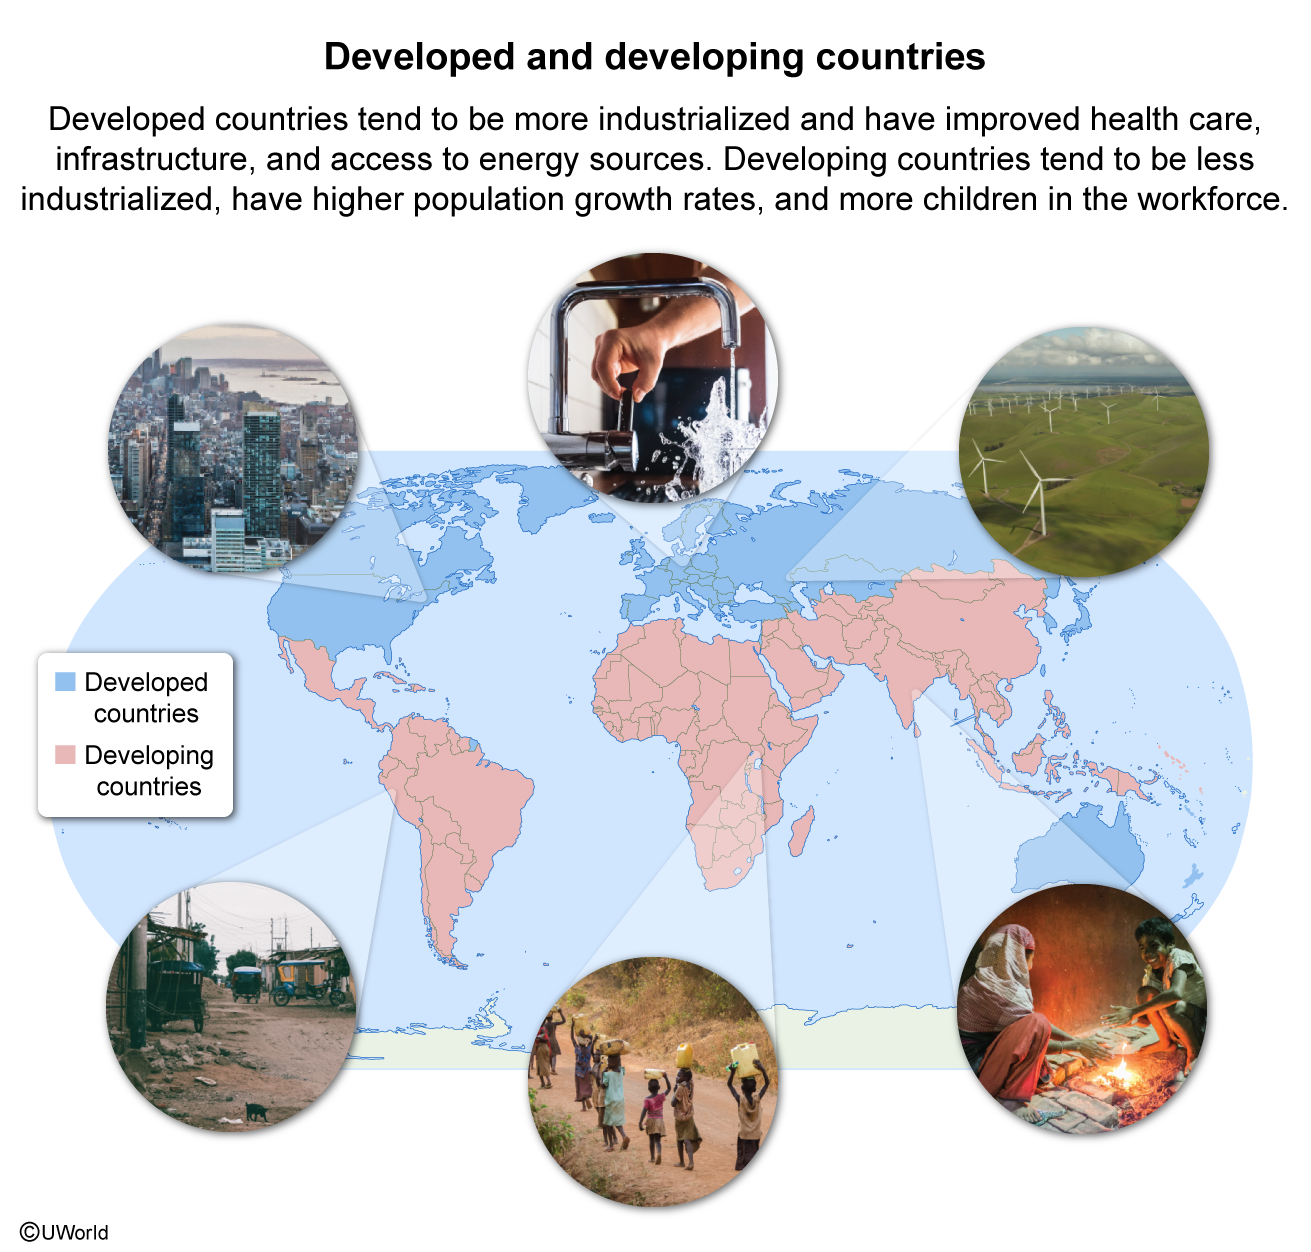
Scientists are interested in determining how a country's development status impacts the country's reliance on fossil fuels. Partway through the study, one of the developing countries the scientists were studying decided to accept investments designed to increase the development of its economy.
Which of the following best explains how the investments could change the conclusion of their study?
| A. The reliance on fossil fuels would increase because as a country becomes more developed, the consumption of energy increases. | |
| B. The reliance on fossil fuels would decrease because as a country becomes more developed, the infrastructure to transport goods improves. | |
| C. The reliance on fossil fuels would not change because as a country becomes more developed, technological innovations increase the efficiency of power plants. | |
| D. The reliance on fossil fuels would not change because as a country becomes more developed, urbanization decreases the number of people in the workforce. |
Explanation

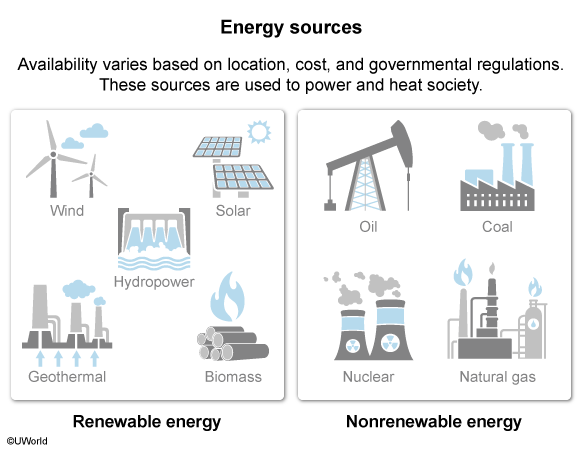
Fossil fuels, such as coal, natural gas, and crude oil, are nonrenewable resources that can be extracted and burned to release energy. When burned, these resources can produce electricity, which can be used for powering manufacturing plants and heating homes.
According to the scenario, a country decides to accept outside investments to increase the development of its economy. Because economic development is linked to an increase in the consumption of goods and energy, the investments are likely to increase the country's reliance on fossil fuels.
|
|
An industrialized country can decrease its reliance on fossil fuels by investing in renewable energy technologies like solar and wind energy. |
(Choice B) Although transportation infrastructure can be improved as a country becomes developed, the increase in the number of goods being transported and consumed leads to an increase, not a decrease, in reliance on fossil fuels.
(Choice C) If the efficiency of power plants were to increase, it would be expected that the reliance on fossil fuels would decrease, not stay the same.
(Choice D) Generally, as a country transitions from developing to developed, urbanization also increases, resulting in an increase, not a decrease, in the number of people in the workforce.
Things to remember:
The reliance on fossil fuels tends to increase as a developing
country becomes more economically developed.
Question
Scientists want to investigate whether hydroelectric dams impact plants in riparian zones. Scientists suspect that plants in upstream floodplains are affected by the construction of hydroelectric dams. Which of the following best identifies a testable hypothesis for the investigation?
| A. The decreasing amount of silt that flows into floodplains will decrease the survivorship of plants in upstream floodplains. | |
| B. The decreasing flow of the river will increase desertification and cause a loss of plants in upstream floodplains. | |
| C. There will be a greater percentage of plants in upstream floodplains that survive than freshwater aquatic plants that survive. | |
| D. The increasing water levels of the dams' reservoirs will increase the loss of plants in upstream floodplains. |
Explanation

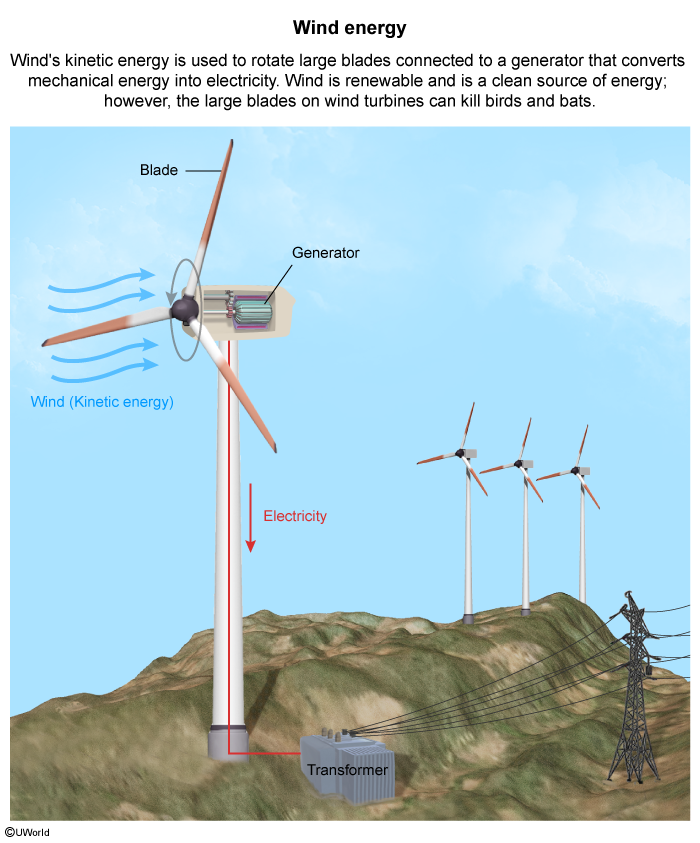
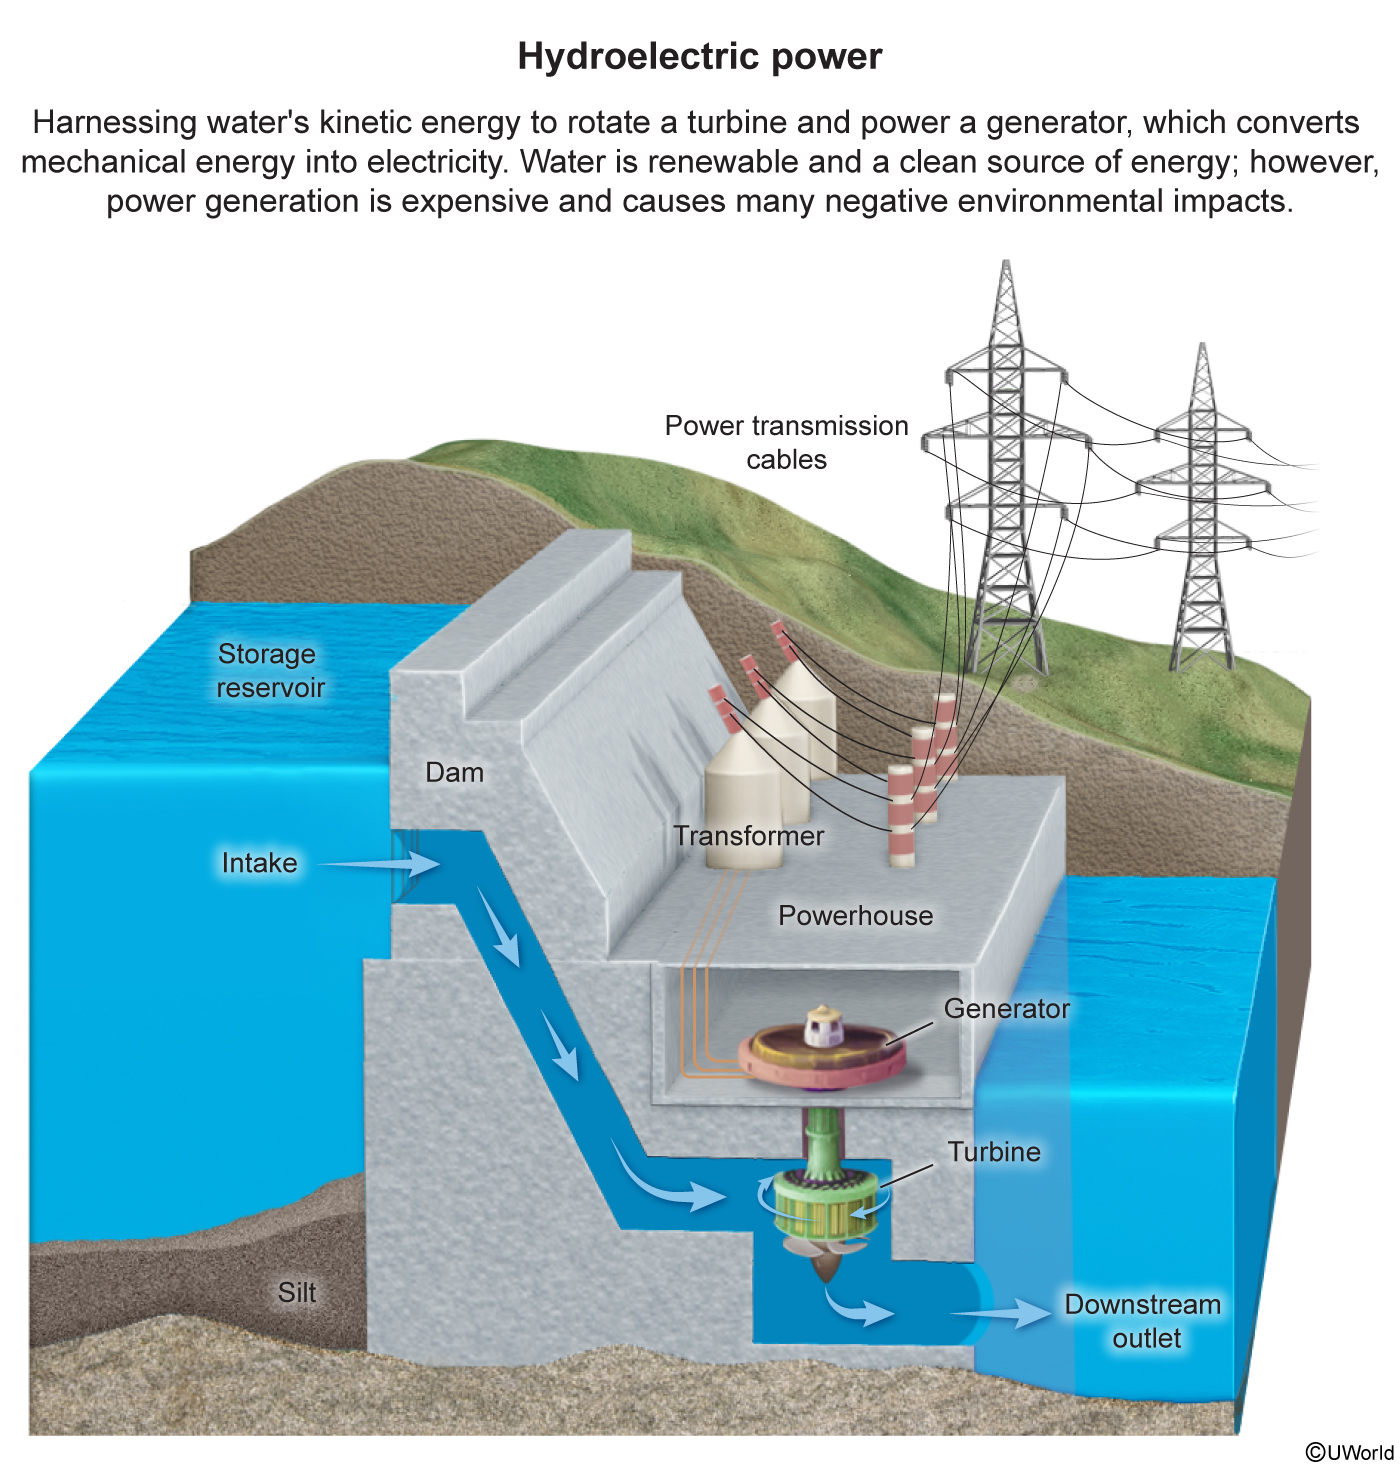
Hydroelectric dams are used to generate a renewable form of energy called hydroelectric power. These dams hold water in a reservoir and release the water to turn turbines and thereby generate electricity. This form of electricity production is considered a clean energy source because operation of the dams emits no air pollution and generates no waste.
However, the construction of large dams is expensive and can fragment or destroy habitats. For example, after a dam is built, the increasing water levels in the dams' reservoirs will increase the loss of plants in upstream floodplains due to waterlogging.
(Choice A) The construction of dams will block the flow of silt to downstream, not upstream, floodplains, resulting in decreased survivorship of plants downstream.
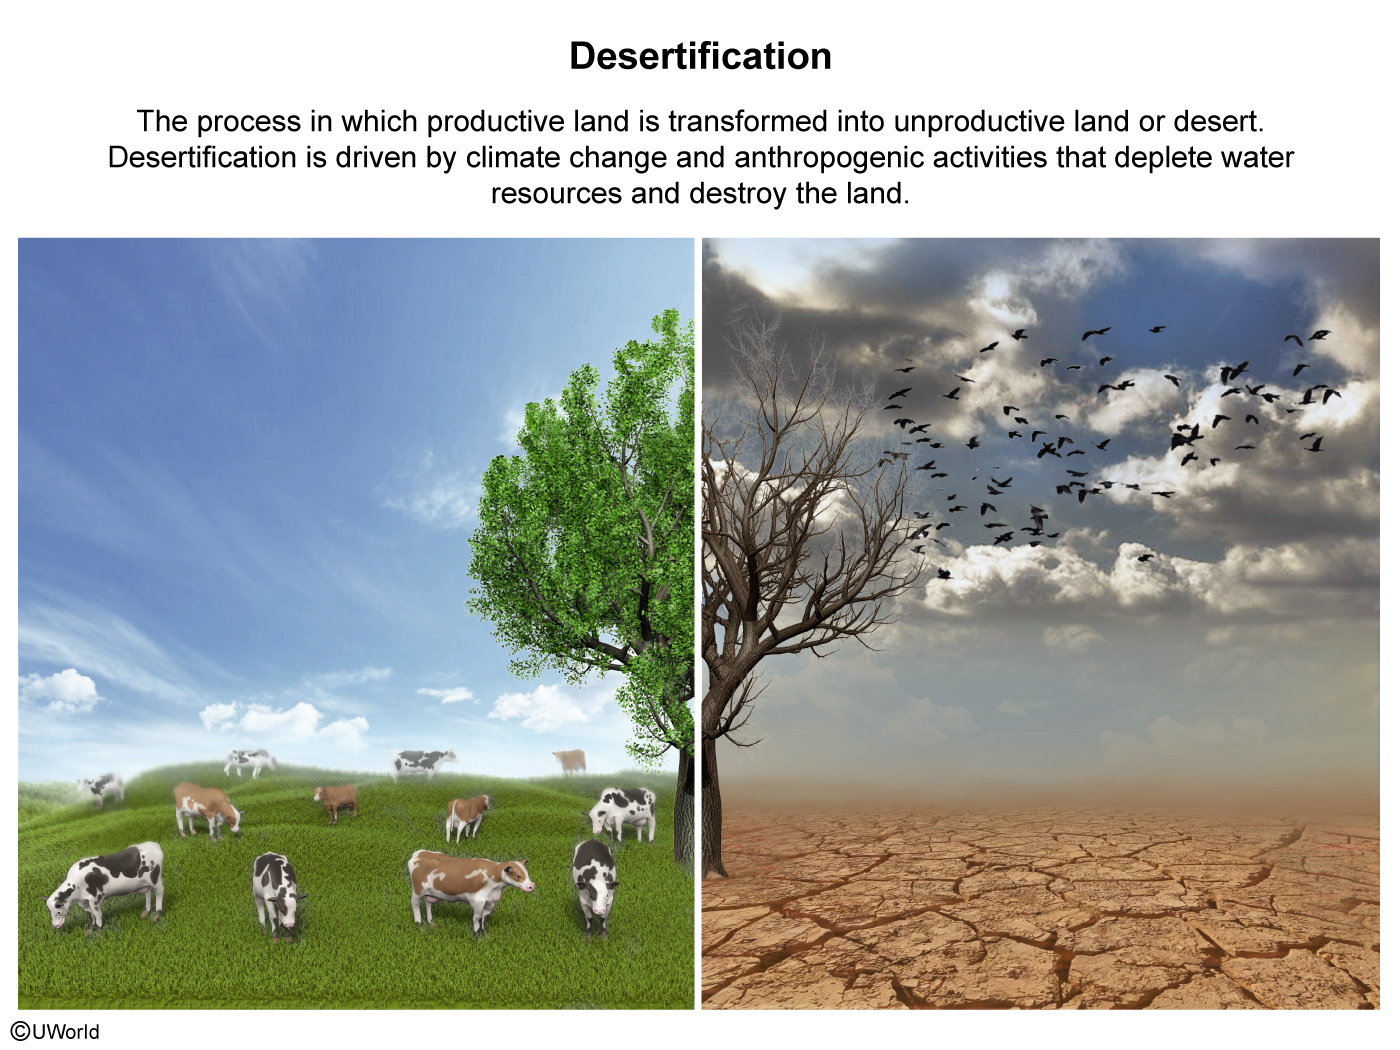
(Choice B) The construction of dams is unlikely cause desertification because the floodplains upstream of the dam will receive more, not less, water due to the creation of the reservoir.
(Choice C) A testable hypothesis includes how the independent variable impacts the dependent variable. This statement is not a testable hypothesis because it provides a dependent variable but lacks an independent variable.
Things to remember:
Although hydroelectric power generation does not release air
pollution or waste, it can require the construction of large dams that are expensive and may fragment or destroy
habitats.
AP Environmental Science Practice Test: Atmospheric Pollution
Passage
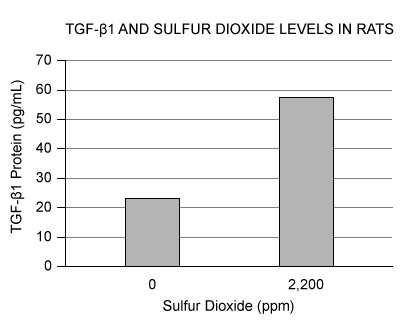
The graph below shows the experimental data from an investigation testing how sulfur dioxide (SO2) in the air can alter the amount of transforming growth factor beta 1 (TGF-β1), a protein used to indicate inflammation, in mammals.
The laboratory experiment was performed with two groups of female rats that were similar in age and size. Each group was housed under identical conditions. Each group was exposed to a different concentration of SO2, and the level of TGF-β1 in their lungs was measured.
Question
Which of the following conclusions can be drawn from the investigation?
| A. The dependent variable causes asphyxiation in the rats. | |
| B. The independent variable acts as an air pollutant. | |
| C. The independent variable impacts the control group the least. | |
| D. The dependent variable is elevated across all groups. |
Explanation

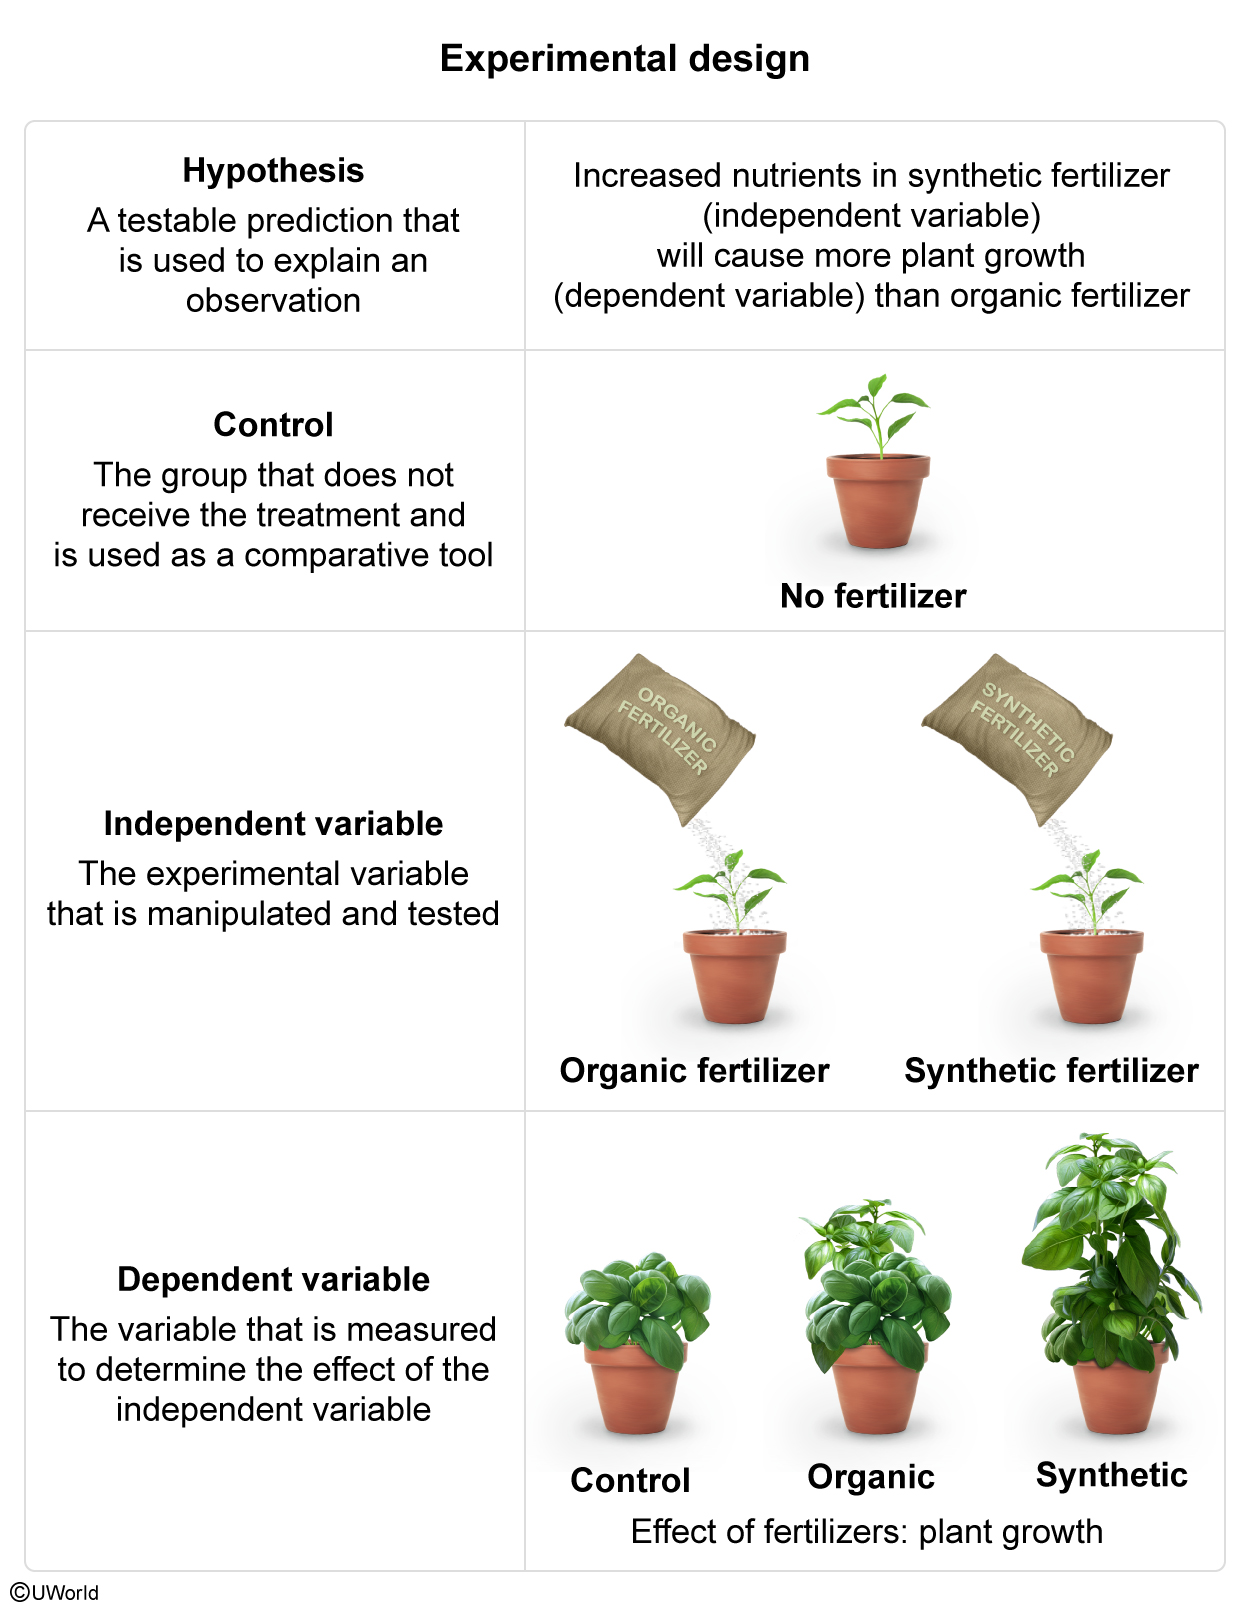
In the given scenario, scientists were investigating the effects of sulfur dioxide (SO2) exposure on transforming growth factor beta 1 (TGF-β1) levels. In the experiment:
- SO2 is the independent variable.
- TGF-β1 protein level is the dependent variable.
When comparing the results of the experimental group to the control (group that did not receive SO2), it can be determined that SO2 exposure increases the amount of TGF-β1 in the lungs of rats. Because TGF-β1 is a marker of inflammation, it can be concluded that SO2 exposure causes negative health impacts.
Any atmospheric chemical or particulate that negatively impacts organisms' health, survival, or activities and decreases air quality is considered an air pollutant. Based on the results of the investigation, SO2, the independent variable, acts as an air pollutant.
(Choice A) Although SO2 exposure can result in asphyxiation (lack of oxygen), SO2 was the independent, not the dependent, variable.
(Choice C) In the scenario, the independent variable was SO2. The control group was not exposed to SO2 and therefore was not impacted by the independent variable.
(Choice D) Although the rats in the experimental groups had elevated TGF-β1 levels in their lungs, the level of TGF-β1 in the control group was not considered elevated because it served as a baseline measurement.
Things to remember:
Sulfur dioxide (SO2) is considered an air pollutant
because it can negatively impact organisms' health, survival, or activities and decreases air quality.
Question
Which of the following diagrams correctly illustrates the formation of acid rain?
A.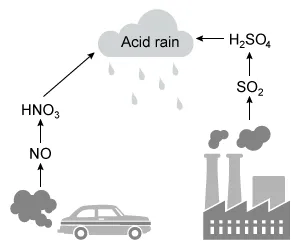 |
|
B.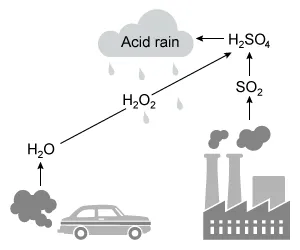 |
|
C. 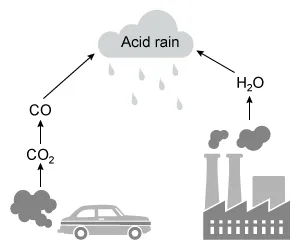 |
|
D. 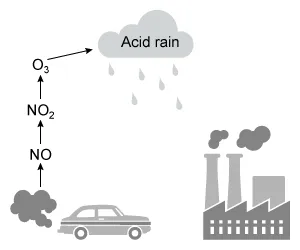 |
Explanation
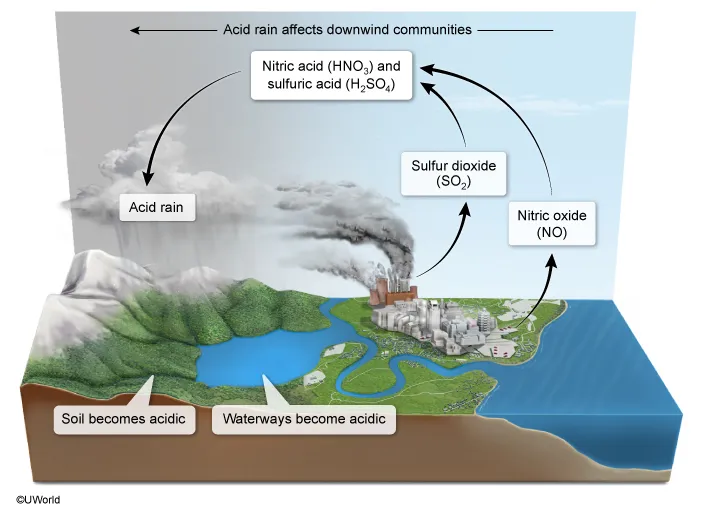
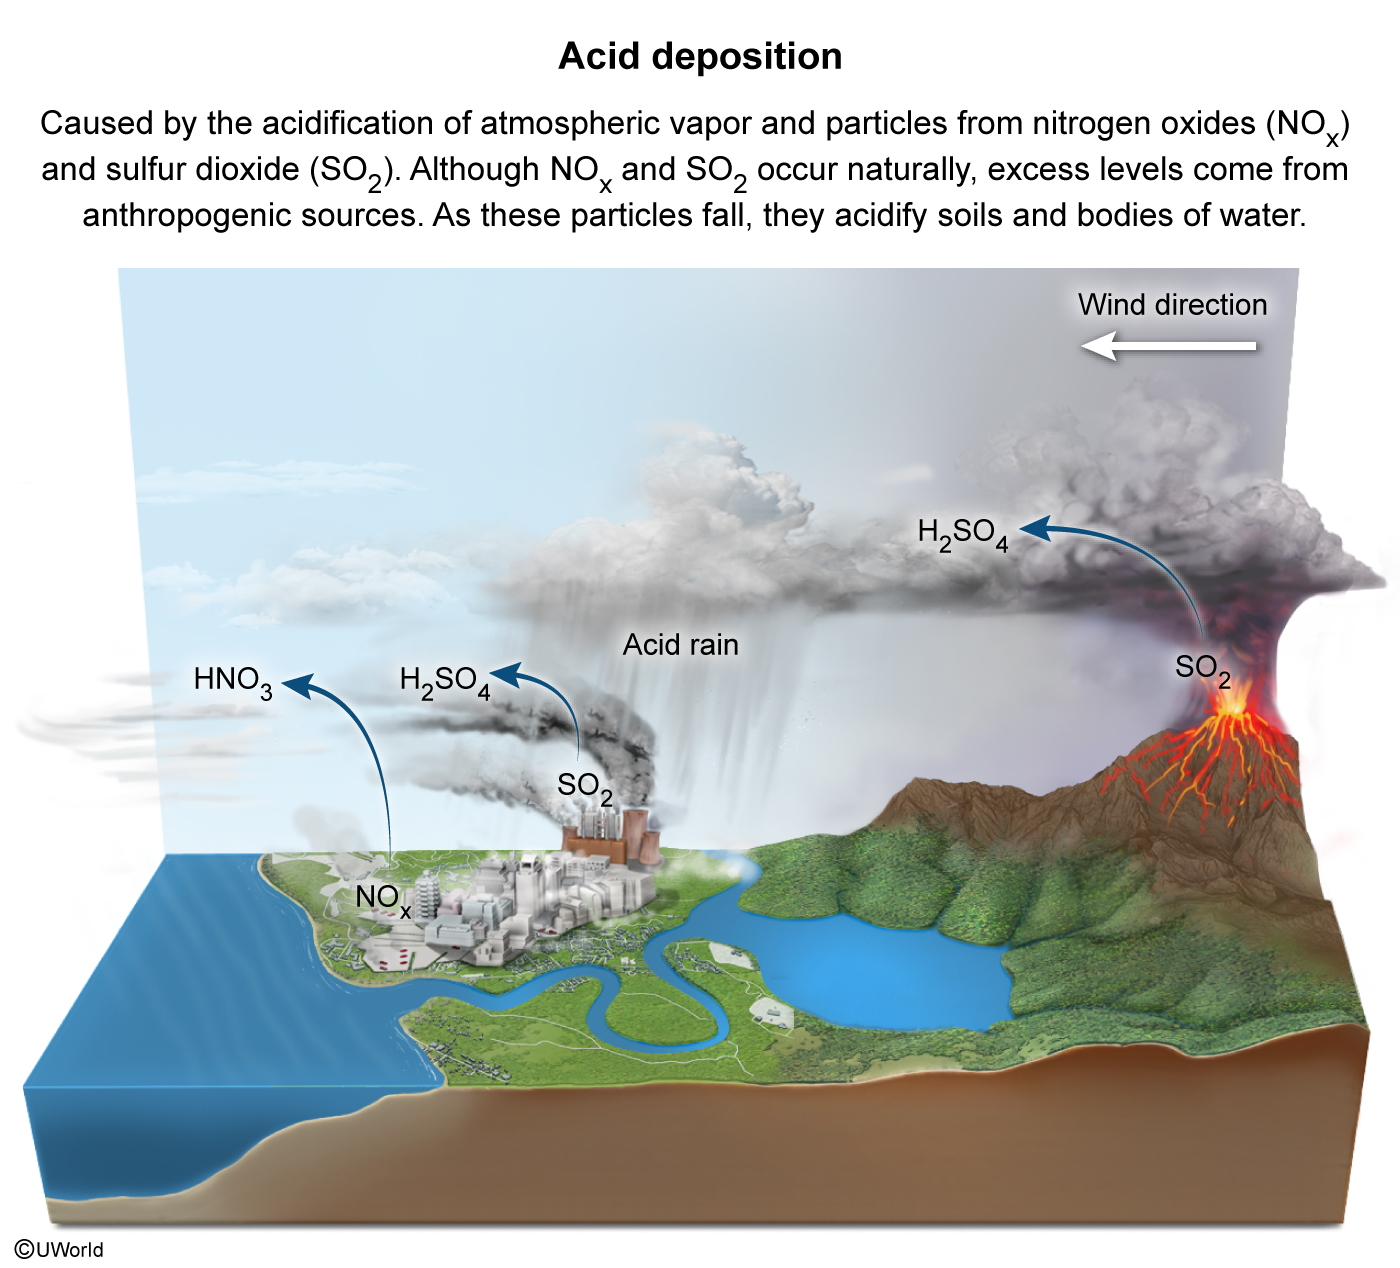
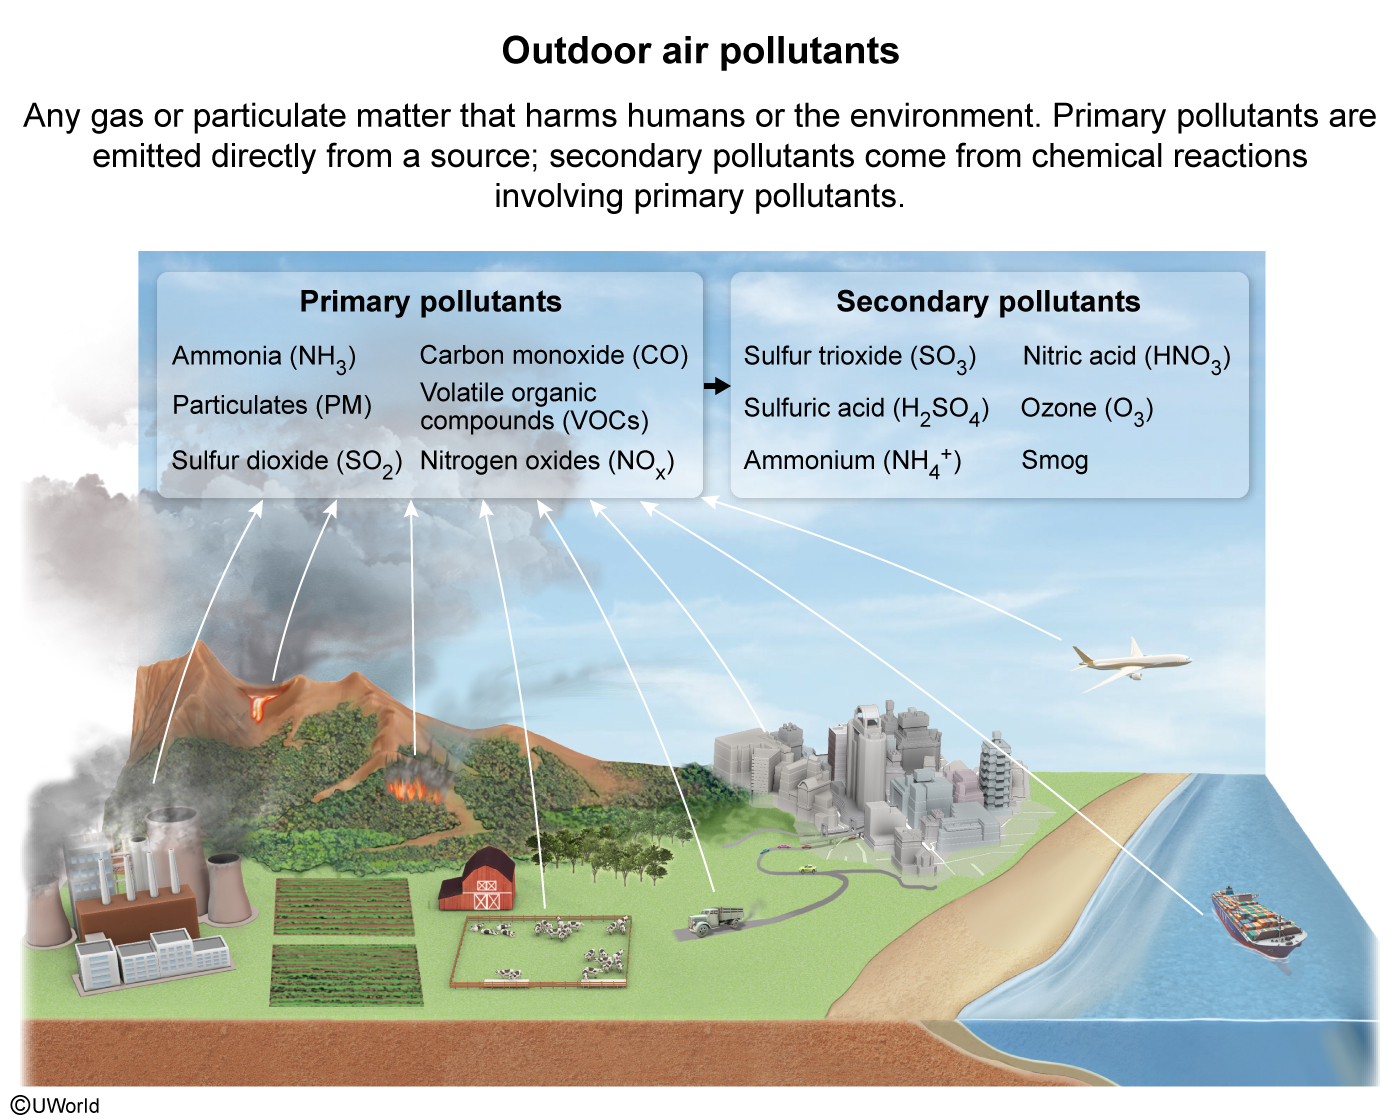
Acid rain, also known as acid deposition, occurs after nitric oxides (NOx), such as nitric oxide (NO), and sulfur oxides (SOx), such as sulfur dioxide (SO2), transform into nitric acid (HNO3) and sulfuric acid (H2SO4) in the atmosphere.
Although NO and SO2 are naturally occurring compounds, excess amounts originate from anthropogenic activities. For example, NO often comes from vehicle emissions, while SO2 is released from industrial facilities, such as coal-burning power plants. As these acids accumulate, they increase the acidity of atmospheric moisture, which condenses into clouds until gravity causes the water to fall back down to Earth as acid rain.
Therefore, the diagram that correctly illustrates the formation of acid rain is Choice A.
|
|
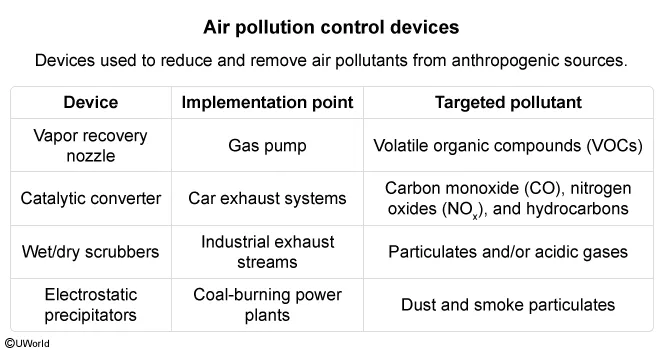
Since 1975, car manufacturers in the US have been required to install catalytic converters in all new cars to help mitigate the impact of air pollution. These devices reduce the emission of hydrocarbons, carbon monoxide, and nitrogen oxides from the tailpipes of vehicles. |
(Choice B) Although SO2 is involved in the formation of acid rain, hydrogen peroxide (H2O2) is not.
(Choices C and D) Carbon dioxide (CO2) and ozone (O3) are not chemically involved in the formation of acid rain.
Things to remember:
Nitric oxides (NOx) and sulfur oxides (SOx) are compounds that lead to acid deposition. NOx primarily comes from vehicle emissions, while SOx primarily released from coal-burning power plants.
Question
Which of the following environmental consequences is most often linked to noise pollution?
| A. Increased rates of auditory cancers in human populations living near airports | |
| B. Alterations in the feeding behavior of aquatic animals | |
| C. Creation of waves that disrupt air flow in the stratosphere | |
| D. Enhanced capabilities for predators who use echolocation |
Explanation

Noise pollution is classified as any harmful or disturbing sound. Thunder and high winds are considered natural sources of noise pollution; however, noise pollution predominantly comes from anthropogenic activities, such as highway driving or shipping.
In any ecosystem, these sounds can disturb the animals within that ecological system by:
- causing stress.
- masking sounds used to hunt and communicate.
- damaging hearing abilities.
- altering migratory routes.
In marine ecosystems, noise pollution spreads over long ranges and is damaging because of marine animals' reliance on sound to communicate, hunt, and navigate. Therefore, one consequence often associated with noise pollution is alterations in the feeding behavior of aquatic animals.
(Choice A) Genetic predisposition, not where people live, is the greatest risk factor for auditory cancers.
(Choice C) Although sound pollution is produced by sound waves traveling through the air, these waves are not strong enough to disrupt air flow in the stratosphere.
(Choice D) Noise pollution inhibits, rather than enhances, the hunting ability of predators who use echolocation (use of sound waves to navigate within an ecosystem).
Things to remember:
Noise pollution causes stress in animals. It masks the sounds used to
hunt and communicate, damages hearing, and alters migratory routes.
AP Environmental Science Practice Test: Aquatic and Terrestrial Pollution
Question
Anthropogenic activities resulted in significant fragmentation of wetlands in this subtropical/tropical area.
| A. A | |
| B. B | |
| C. C | |
| D. D |
Explanation

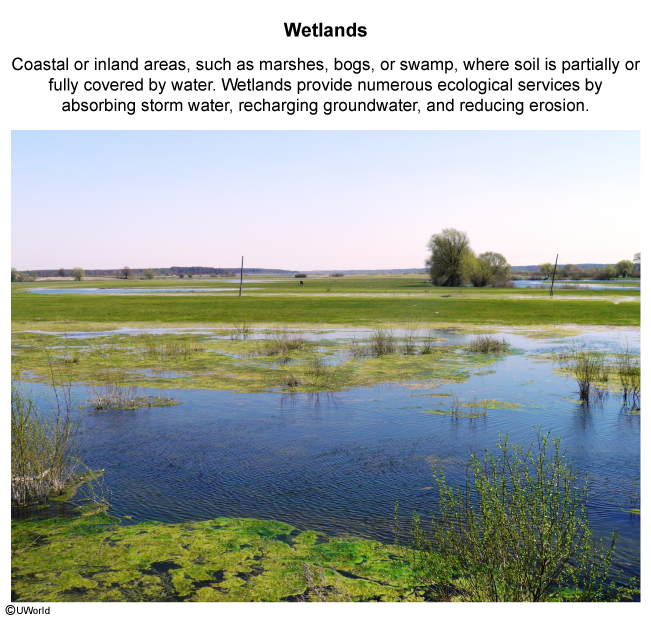
Wetlands, such as marshes, bogs, or swamps, are coastal or inland areas where soil is covered by water during a portion of the growing season. Wetlands are unique because they support both terrestrial and aquatic organisms while serving numerous ecosystem services, such as absorbing storm water, recharging groundwater, and reducing erosion.
Despite having immense ecological and economic value, many wetlands around the world have been lost or are threatened by anthropogenic activities, such as commercial development, overfishing, dam construction, and pollution.
For example, the Everglades, located in subtropical/tropical Florida (Choice A), once consisted of wetlands and a 100-km-wide river fed by Lake Okeechobee. However, in the late 20th century, anthropogenic activities, such as water diversion and agricultural development, resulted in fragmentation of this wetland ecosystem.
|
|
In 2000, the US government authorized the Comprehensive Everglades Restoration Plan to return the natural flow of water, reestablish degraded ecological services, and reduce the impact of fragmentation in southern Florida. |
(Choices B and C) These areas are considered temperate/polar, not subtropical/tropical.
(Choice D) Although this area does have a subtropical/tropical climate, the large area of desert in central Australia results in the majority of the human population living along the coastal regions. Therefore, significant fragmentation of wetlands due to anthropogenic activities has not occurred.
Things to remember:
Wetlands are globally threatened from commercial development, dam
construction, overfishing, and pollution.
Passage
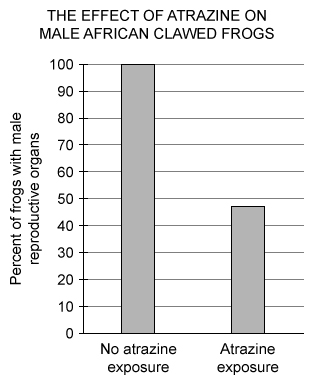
African clawed frogs were used to study the effects of atrazine in an ecosystem. Scientists hypothesized that atrazine is an endocrine disruptor. In a laboratory study, the scientists observed two groups of gentically male African clawed frogs from the larval stage through sexual maturity, one with and one without atrazine exposure in the larval stage. At the age of sexual maturity, data for the percentages of the frogs that had mature male reproductive organs were collected and presented in the following graph.
Question
Which of the following best interprets the results in the graph in relation to the given hypothesis?
| A. The results support the scientists' hypothesis because there was a lower percentage of frogs that developed male reproductive organs after no exposure to atrazine. | |
| B. The results support the scientists' hypothesis because there was a lower percentage of frogs that developed male reproductive organs after exposure to atrazine. | |
| C. The results do not support the scientists' hypothesis because there was a higher percentage of frogs that developed male reproductive organs after no exposure to atrazine. | |
| D. The results do not support the scientists' hypothesis because there was a higher percentage of frogs that developed male reproductive organs after atrazine exposure. |
Explanation

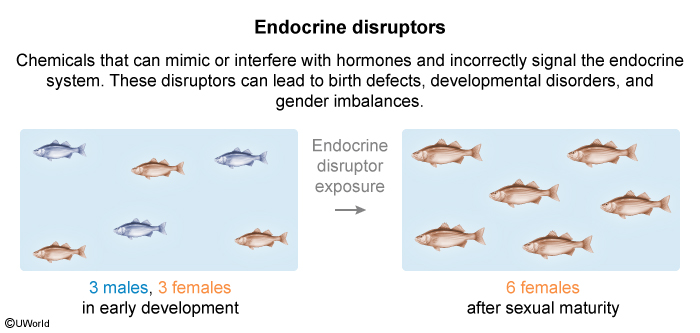
During the study, scientists hypothesized that atrazine is an endocrine disruptor. Endocrine disruptors are chemicals that can interfere with an animal's endocrine system by mimicking or blocking hormones that normally control many of the body's functions, including metabolism, growth, and reproduction. These disruptors can lead to birth defects, developmental disorders, and gender imbalances, such as delaying or halting the growth of reproductive organs in some animals.
Based on the study and the graph, at sexual maturity:
- without atrazine exposure, 100% of the frogs developed male reproductive organs.
- with atrazine exposure, approximately 50% of the frogs developed male reproductive organs.
Therefore, atrazine impacts the development of the frogs' sexual organs and is likely an endocrine disruptor, which supports the scientists' hypothesis because there was a lower percentage of frogs that developed male reproductive organs after exposure to atrazine.
(Choice A) Although the results did support the hypothesis, there was a higher, not lower, percentage of frogs that developed male reproductive organs without atrazine exposure.
(Choices C and D) The results did support the scientists' hypothesis because atrazine caused reproductive organ abnormalities, an effect of endocrine disruptors.
Things to remember:
Endocrine disruptors are chemicals that interfere with the function
of animal endocrine systems and the production of hormones.
Question
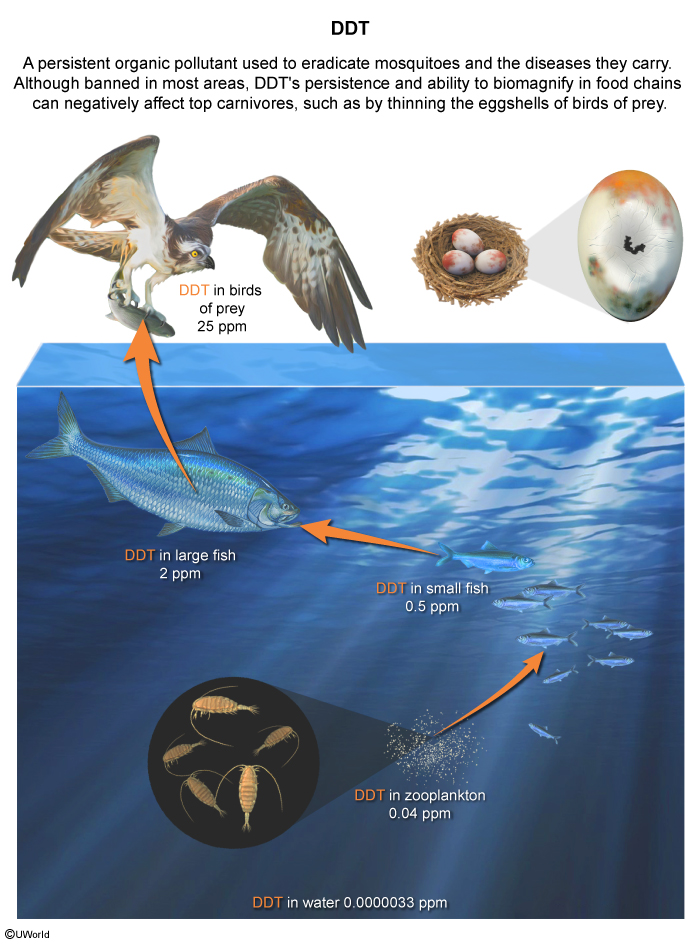
The feeding relationships between several organisms are shown in the food chain below.

Based on the diagram, which of the following best describes the most likely indirect effect of DDT on the food chain?
| A. The osprey population will experience a decline because of the production of thinner eggshells. | |
| B. The osprey population will experience an increase from increasing algae and crayfish populations. | |
| C. The osprey population will decrease from the increase in the acidification of the ecosystem. | |
| D. The osprey population will increase because of decreased competition for food resources. |
Explanation

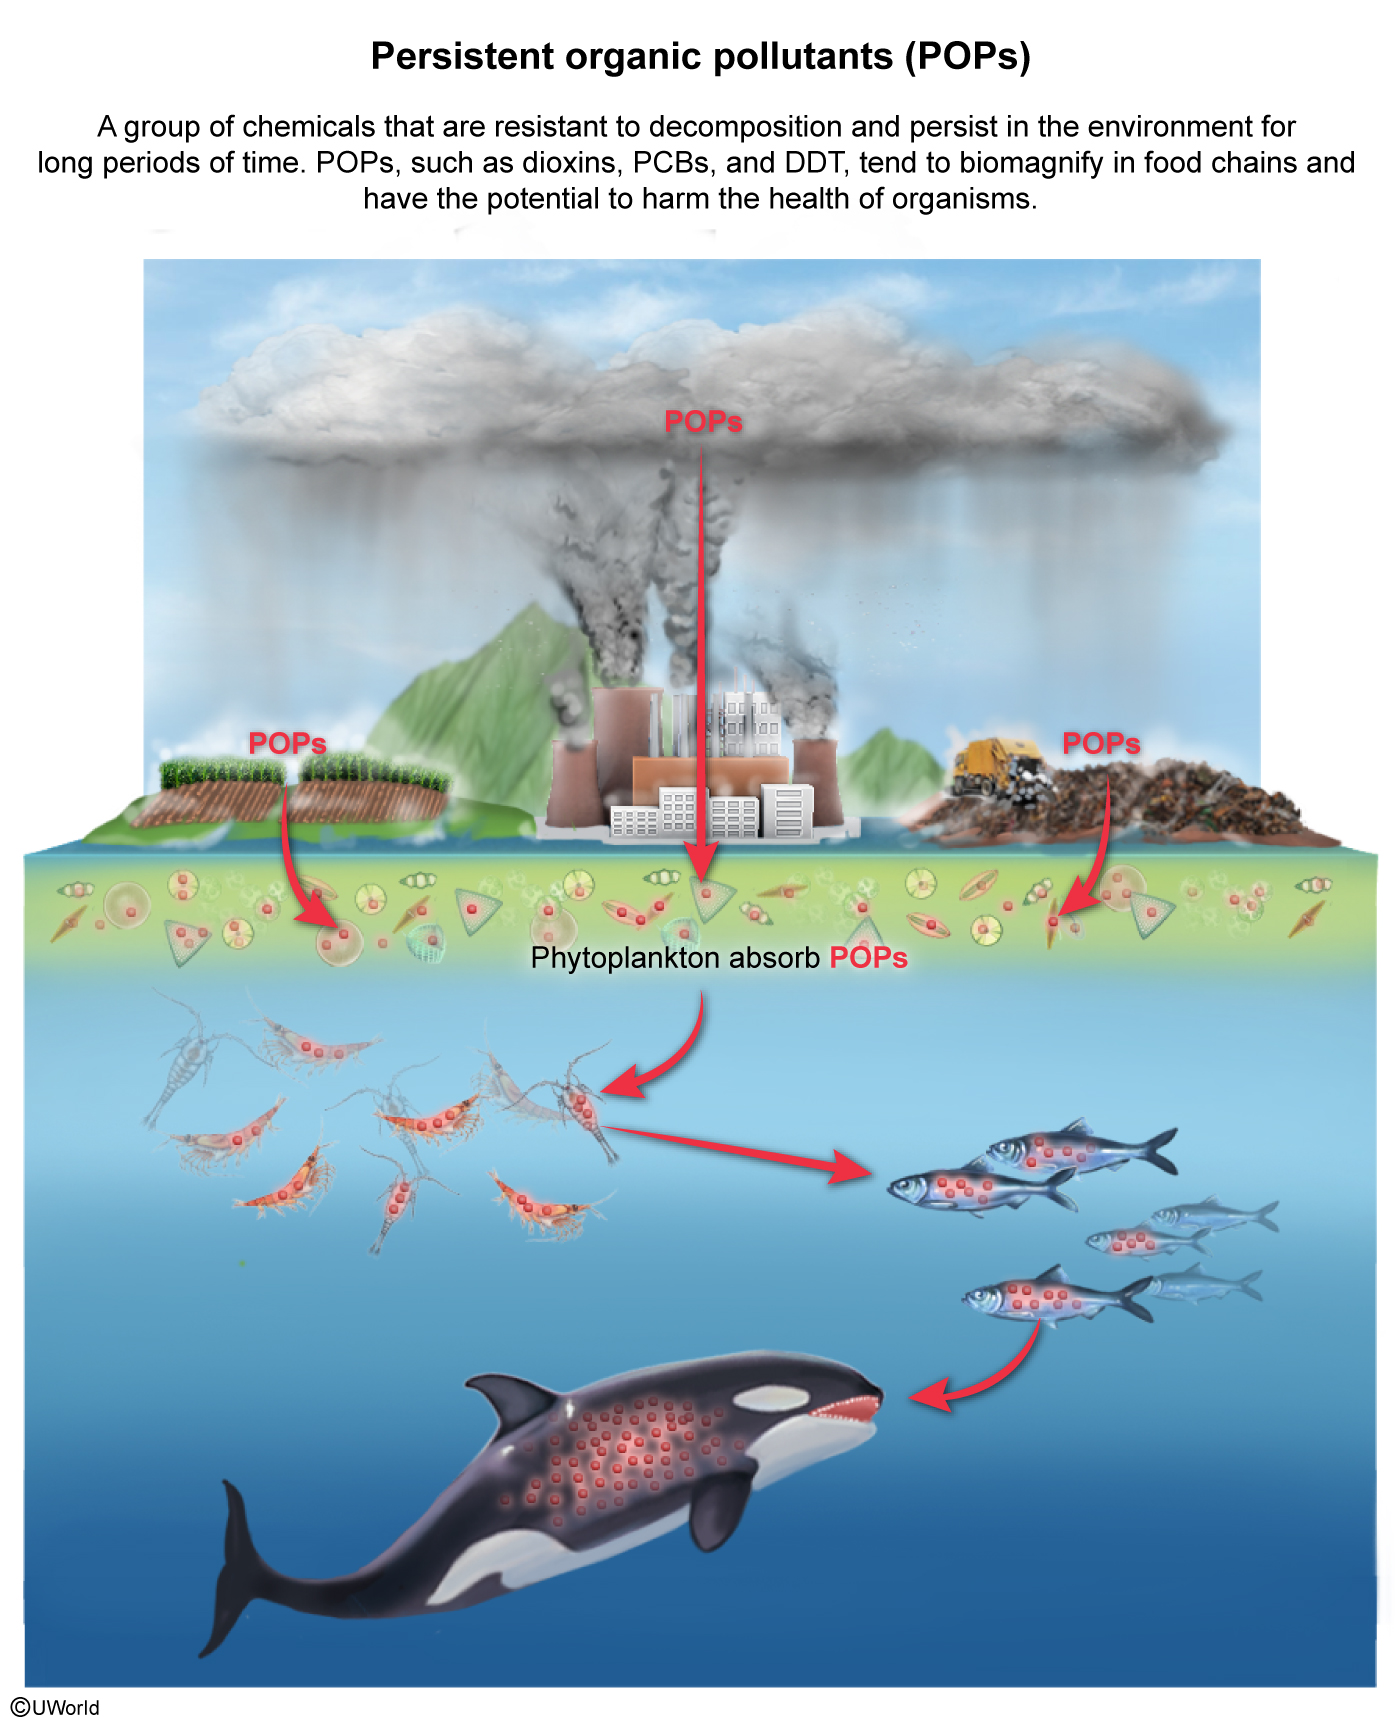
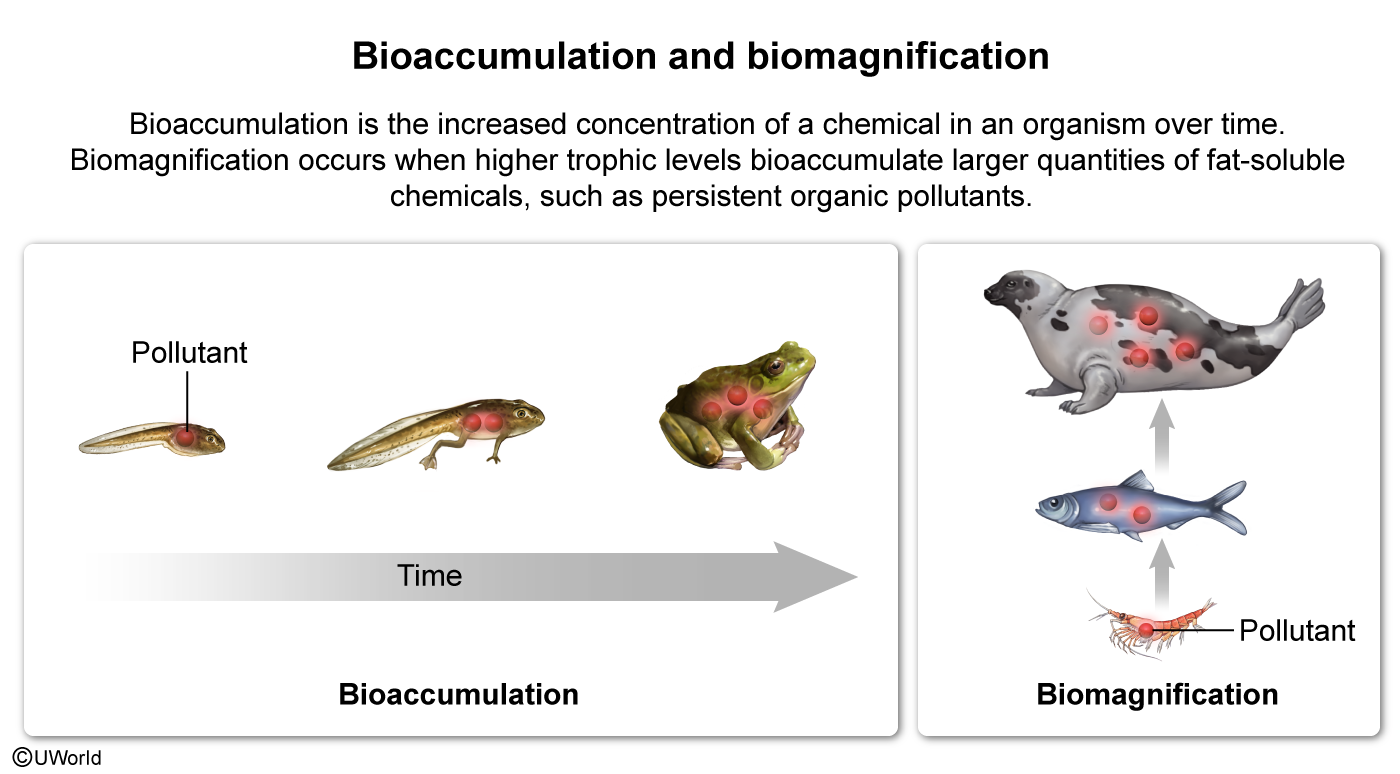
In an ecosystem, organisms at higher trophic levels in a food chain, such as tertiary consumers, will consume more food than those at lower trophic levels. If a persistent organic pollutant (POP), such as DDT, is present in an ecosystem, its accumulation will increase through the various trophic levels with increasing food consumption. This increase in the concentration of a substance along a food chain is known as biomagnification and can lead to negative impacts at higher trophic levels.
Among the negative effects on higher trophic levels caused by the biomagnification of POPs are developmental deformities in top carnivores including eggshell thinning in birds of prey. Thus, an indirect effect of DDT on the food chain pictured above is a decline in the osprey population due to the thinning of their eggshells.
|
|
In 1962, Rachel Carson, a marine biologist and conservationist, highlighted the dangers of DDT on bird populations in her book Silent Spring. Carson is credited with inspiring the environmental movement, which led to the creation of the Environmental Protection Agency (EPA) and subsequent ban of DDT in 1972. |
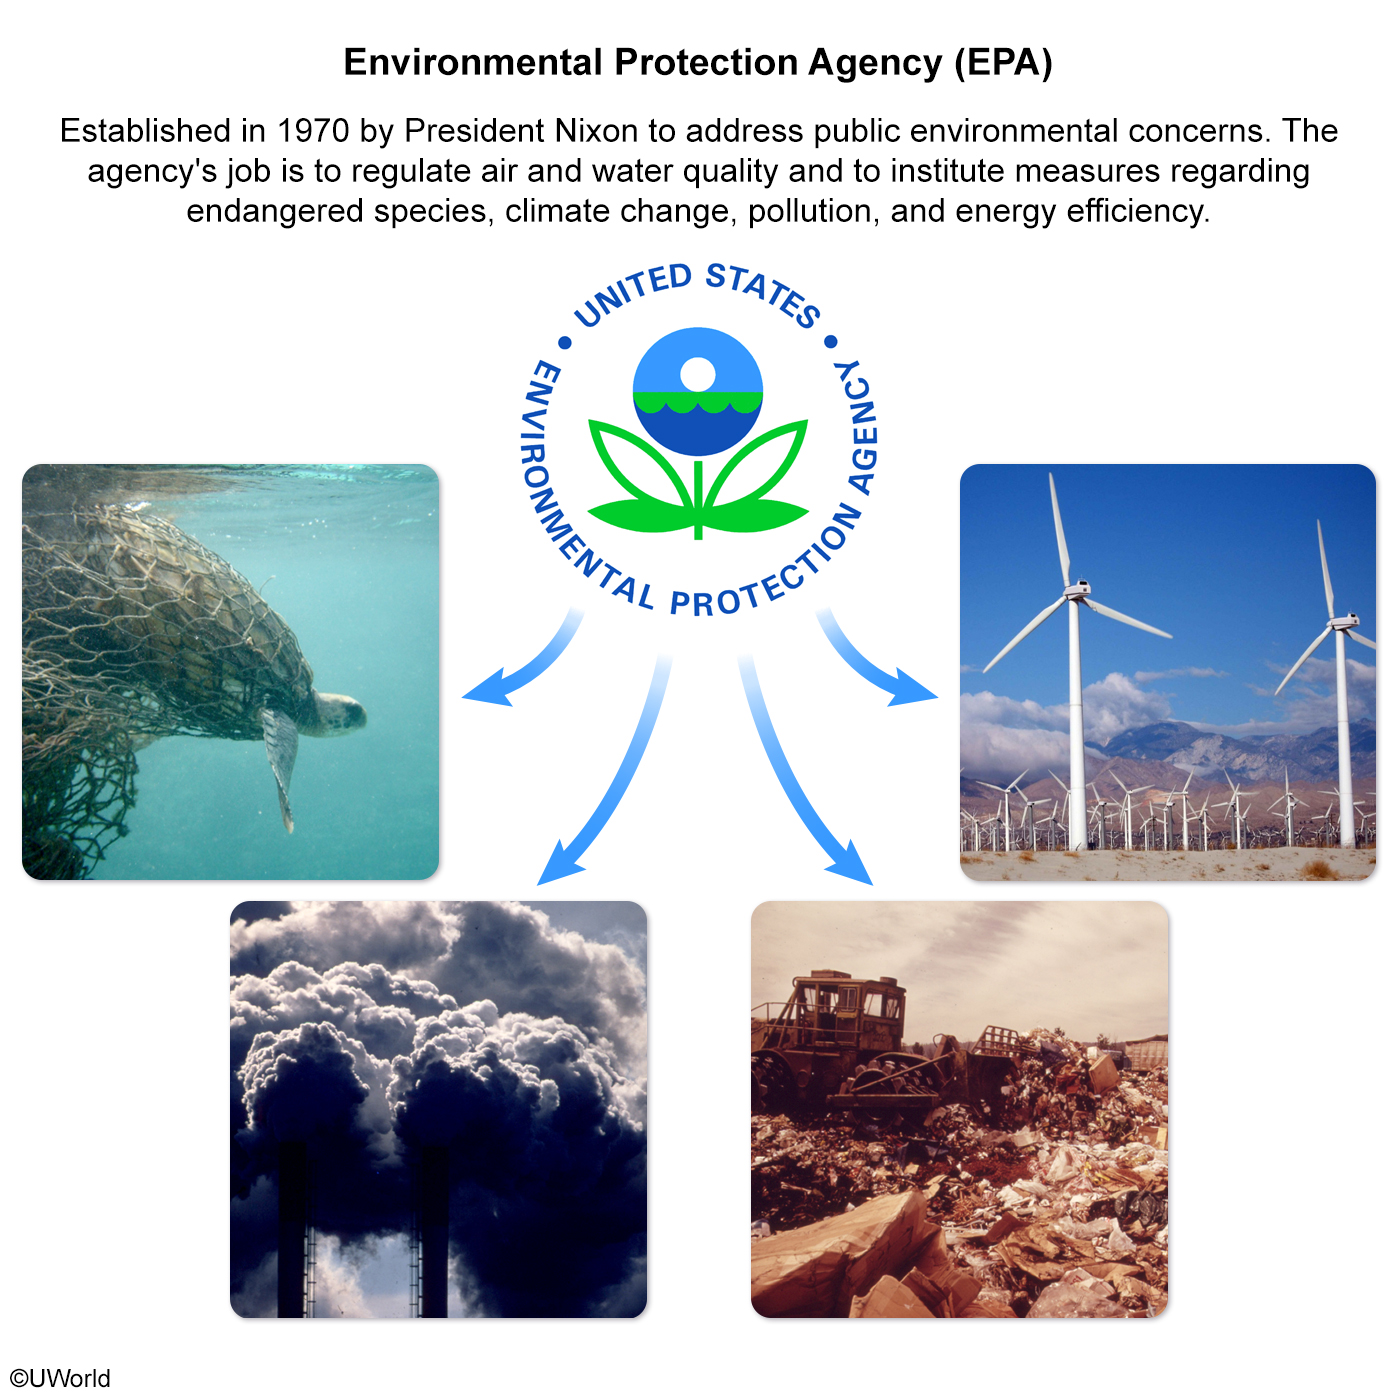
(Choices B and D) DDT is an insecticide that would cause a decrease, not increase, in the algae and crayfish populations. Thus, the decrease in the number of organisms at the lower trophic levels would cause an increase, not a decrease, in competition for food resources.
(Choice C) DDT is not an acid and therefore would not increase the acidification of terrestrial or aquatic ecosystems.
Things to remember:
When a persistent organic pollutant (POP) such as DDT is biomagnified
in a food chain, the increased concentration at higher trophic levels can cause developmental deformities
including eggshell thinning in top predators.
AP Environmental Science Practice Test: Global Change
Question
Which of the following best describes one way the Endangered Species Act helped protect animal populations?
| A. Established the first protected area for the National Wildlife Refuge System. | |
| B. Mandated landowners to control the population size of naturally occurring species that prey on endangered species. | |
| C. Created penalties for developing countries that engage in the sale of products made from endangered species. | |
| D. Introduced regulatory measures stating that federal agencies cannot destroy the habitat of endangered species. |
Explanation

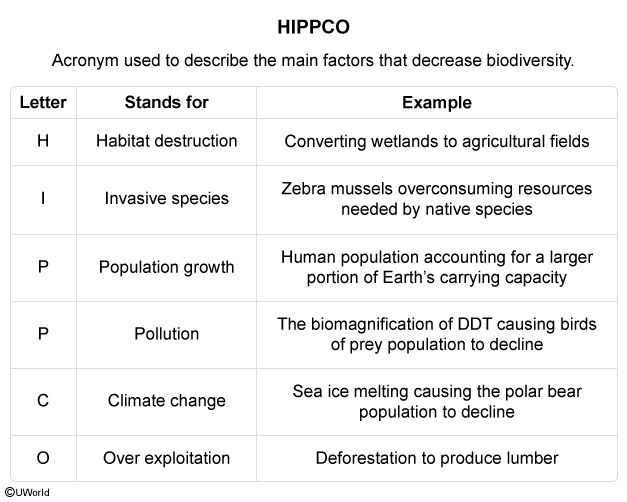
During the 20th century, the human population began a period of rapid growth. This growth led to an increase in housing and commercial development that resulted in fragmented habitats. The loss of habitat, combined with increased threats from hunting and pollution, caused a decrease in biodiversity across the globe.
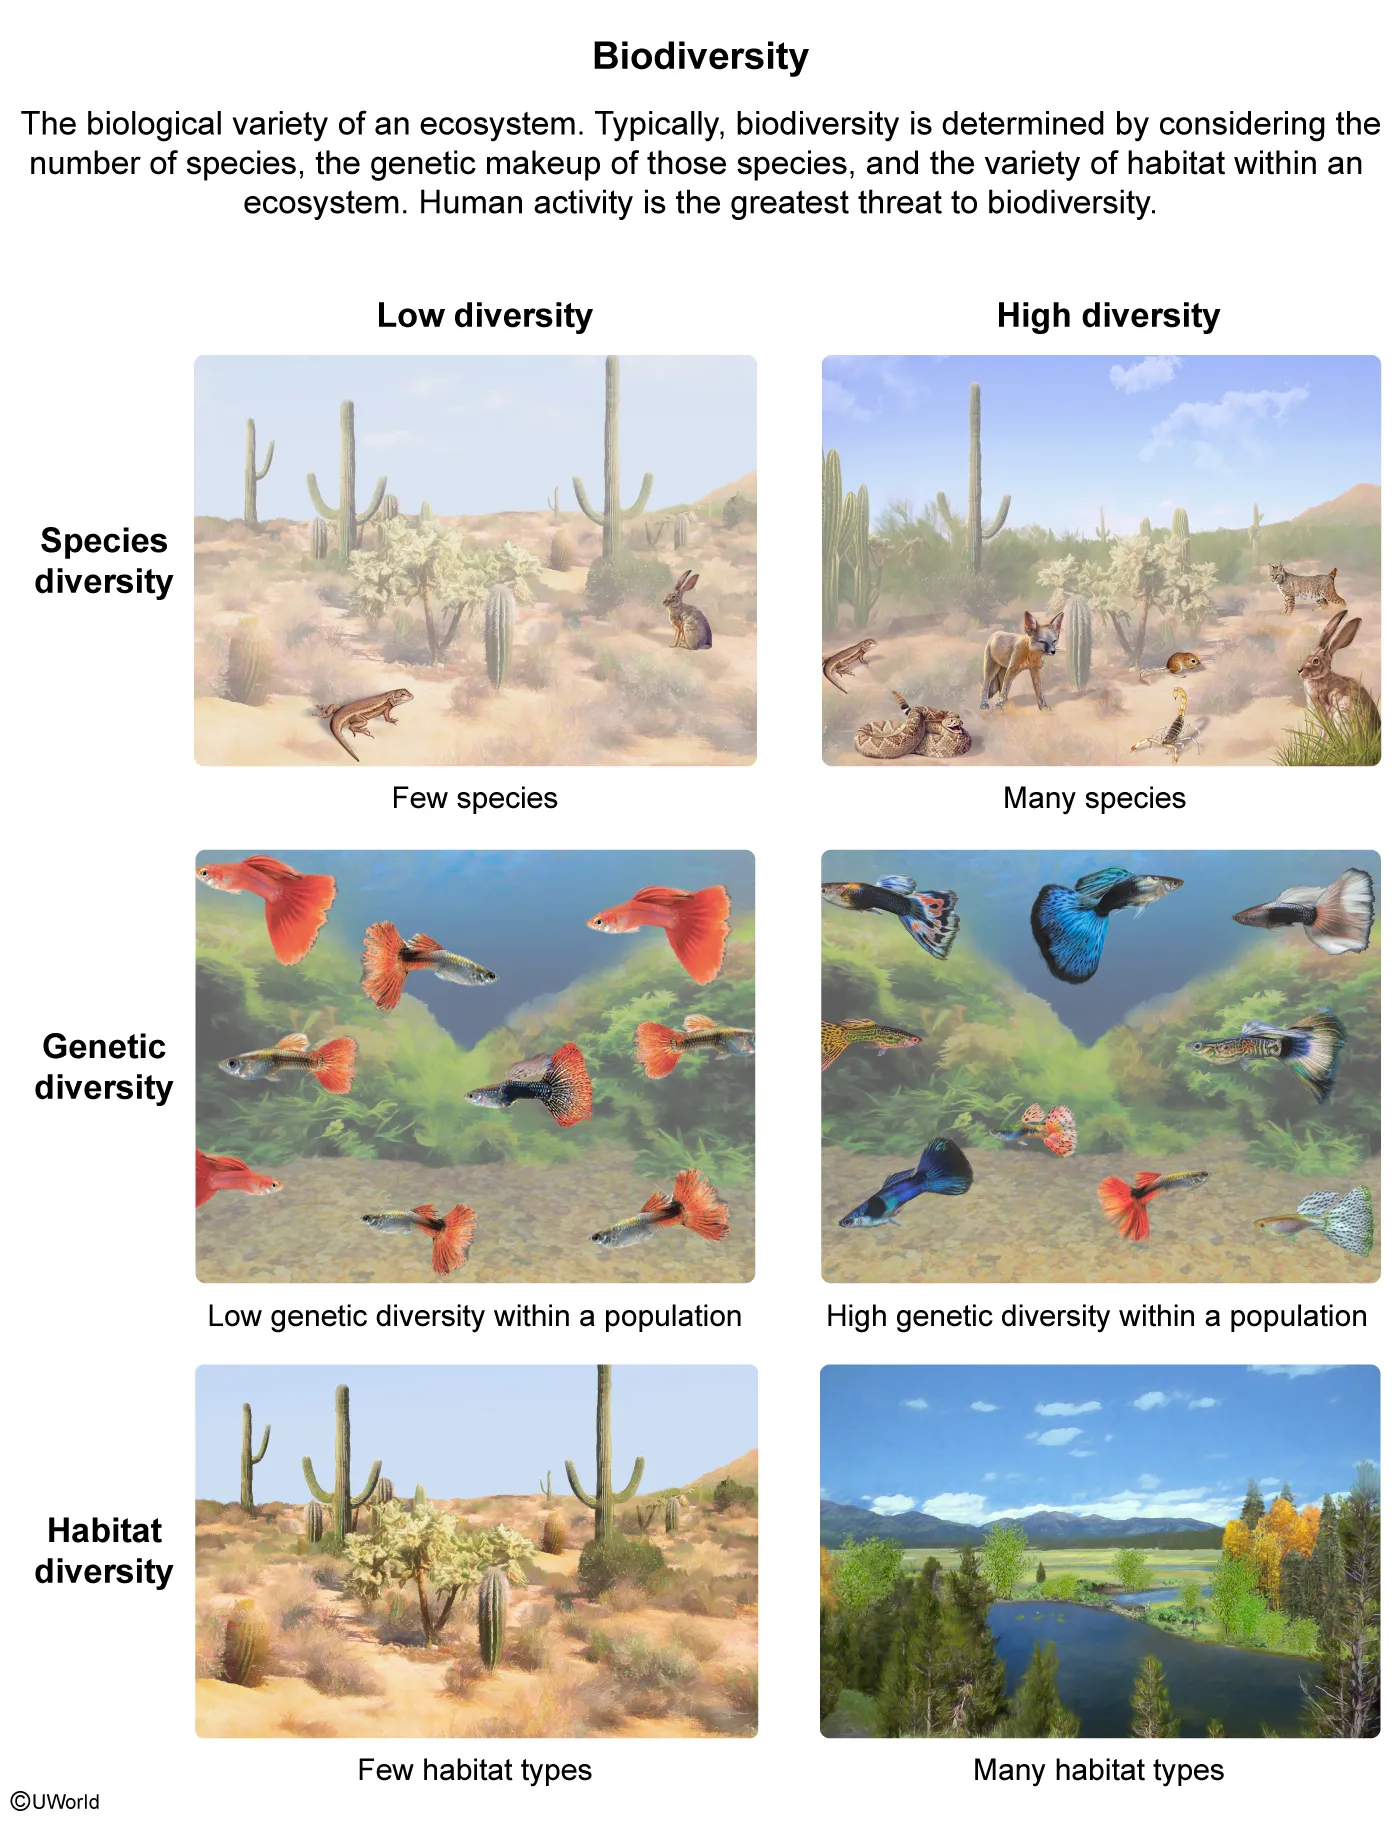
The US government, driven by this loss of biodiversity, enacted the Endangered Species Act (ESA) in 1973. Key provisions of the ESA protected animals by:
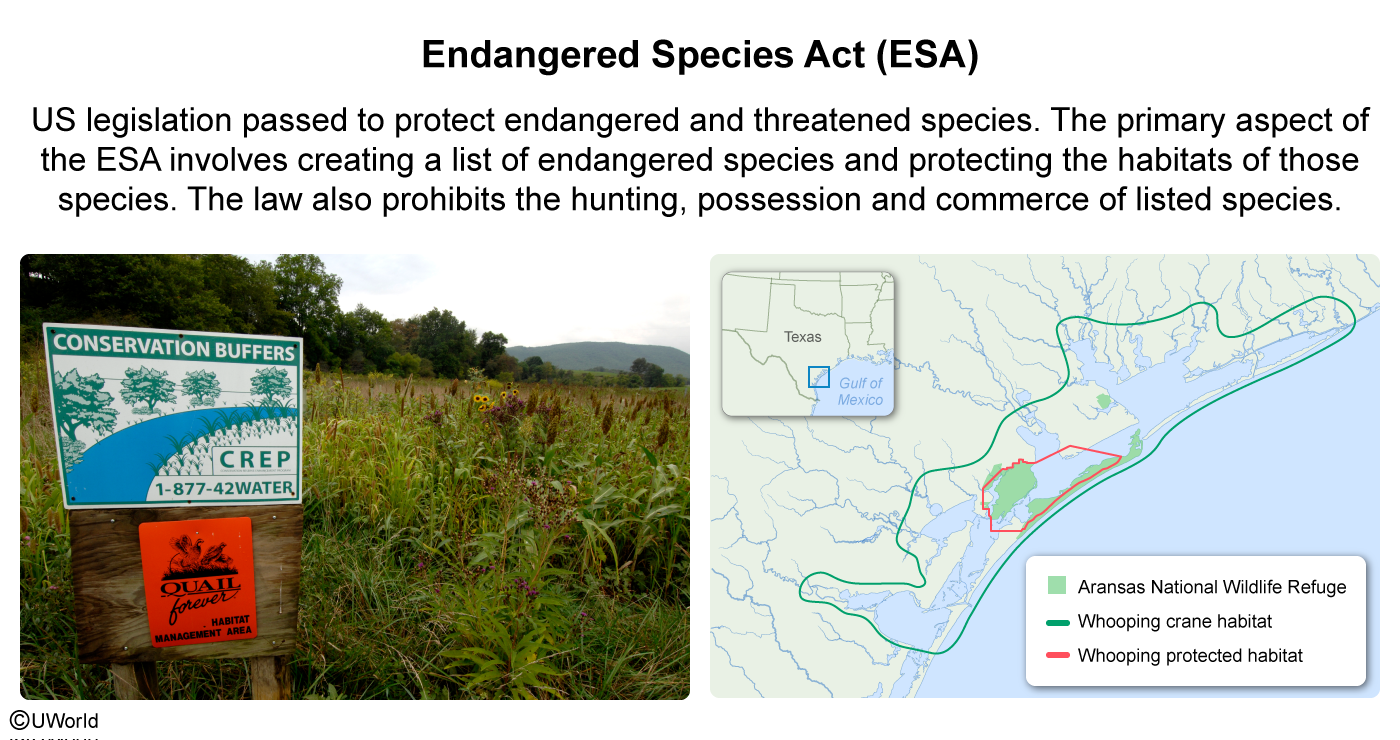
- creating a system to list animals as threatened or endangered.
- prohibiting the import, export, possession, hunting, sale, and transport of listed species.
- designating critical habitat (protected land necessary for the survival of a listed species).
Within the critical habitat provision, the ESA states that the habitat of endangered species cannot be destroyed by individuals or by federal agencies. Through this provision, protected animal habitats enabled the recovery of some threatened species, such as the whooping crane.
(Choice A) The first protected area for the National Wildlife Refuge System was created in 1903; it was not part of the ESA.
(Choice B) Through incentive programs, the ESA encourages rather than mandates landowners to protect endangered species in this way.
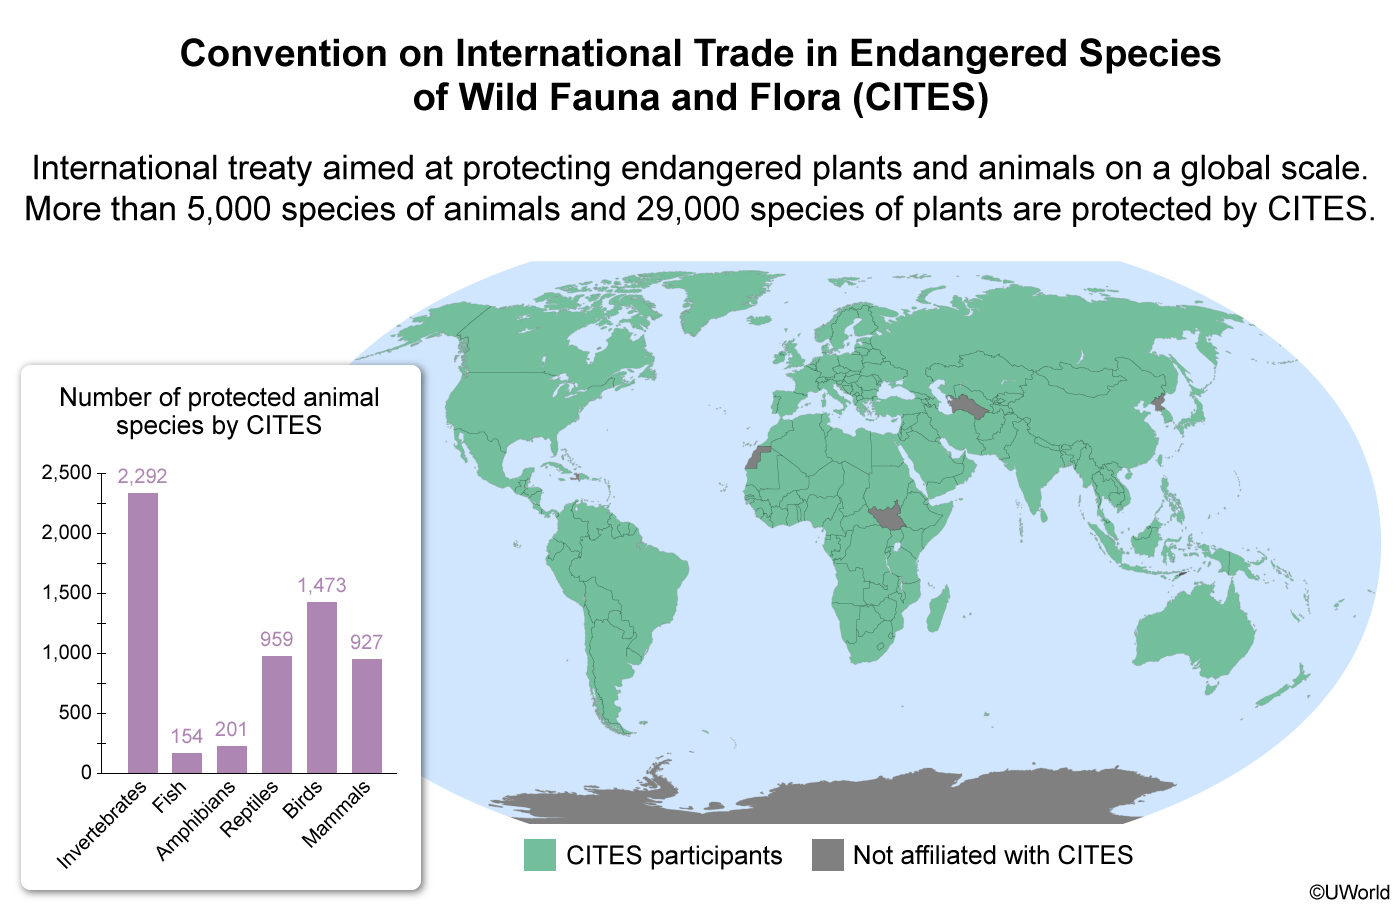
(Choice C) Although the Convention on International Trade in Endangered Species of Wild Fauna and Flora (CITES) provides funds to reduce the sale of products from endangered species, the ESA—a US law—does not penalize other countries.
Things to remember:
The Endangered Species Act, a US law, increases protection of
habitats to safeguard threatened animal populations.
Question
Other than rising sea levels, which of the following is a consequence of climate change?
| A. Changes in climate slow the rate at which carbon dioxide is stored in the tissues of producers. | |
| B. The ecological range of tolerance for marine species narrows to protect species from temperature fluctuations associated with climate change. | |
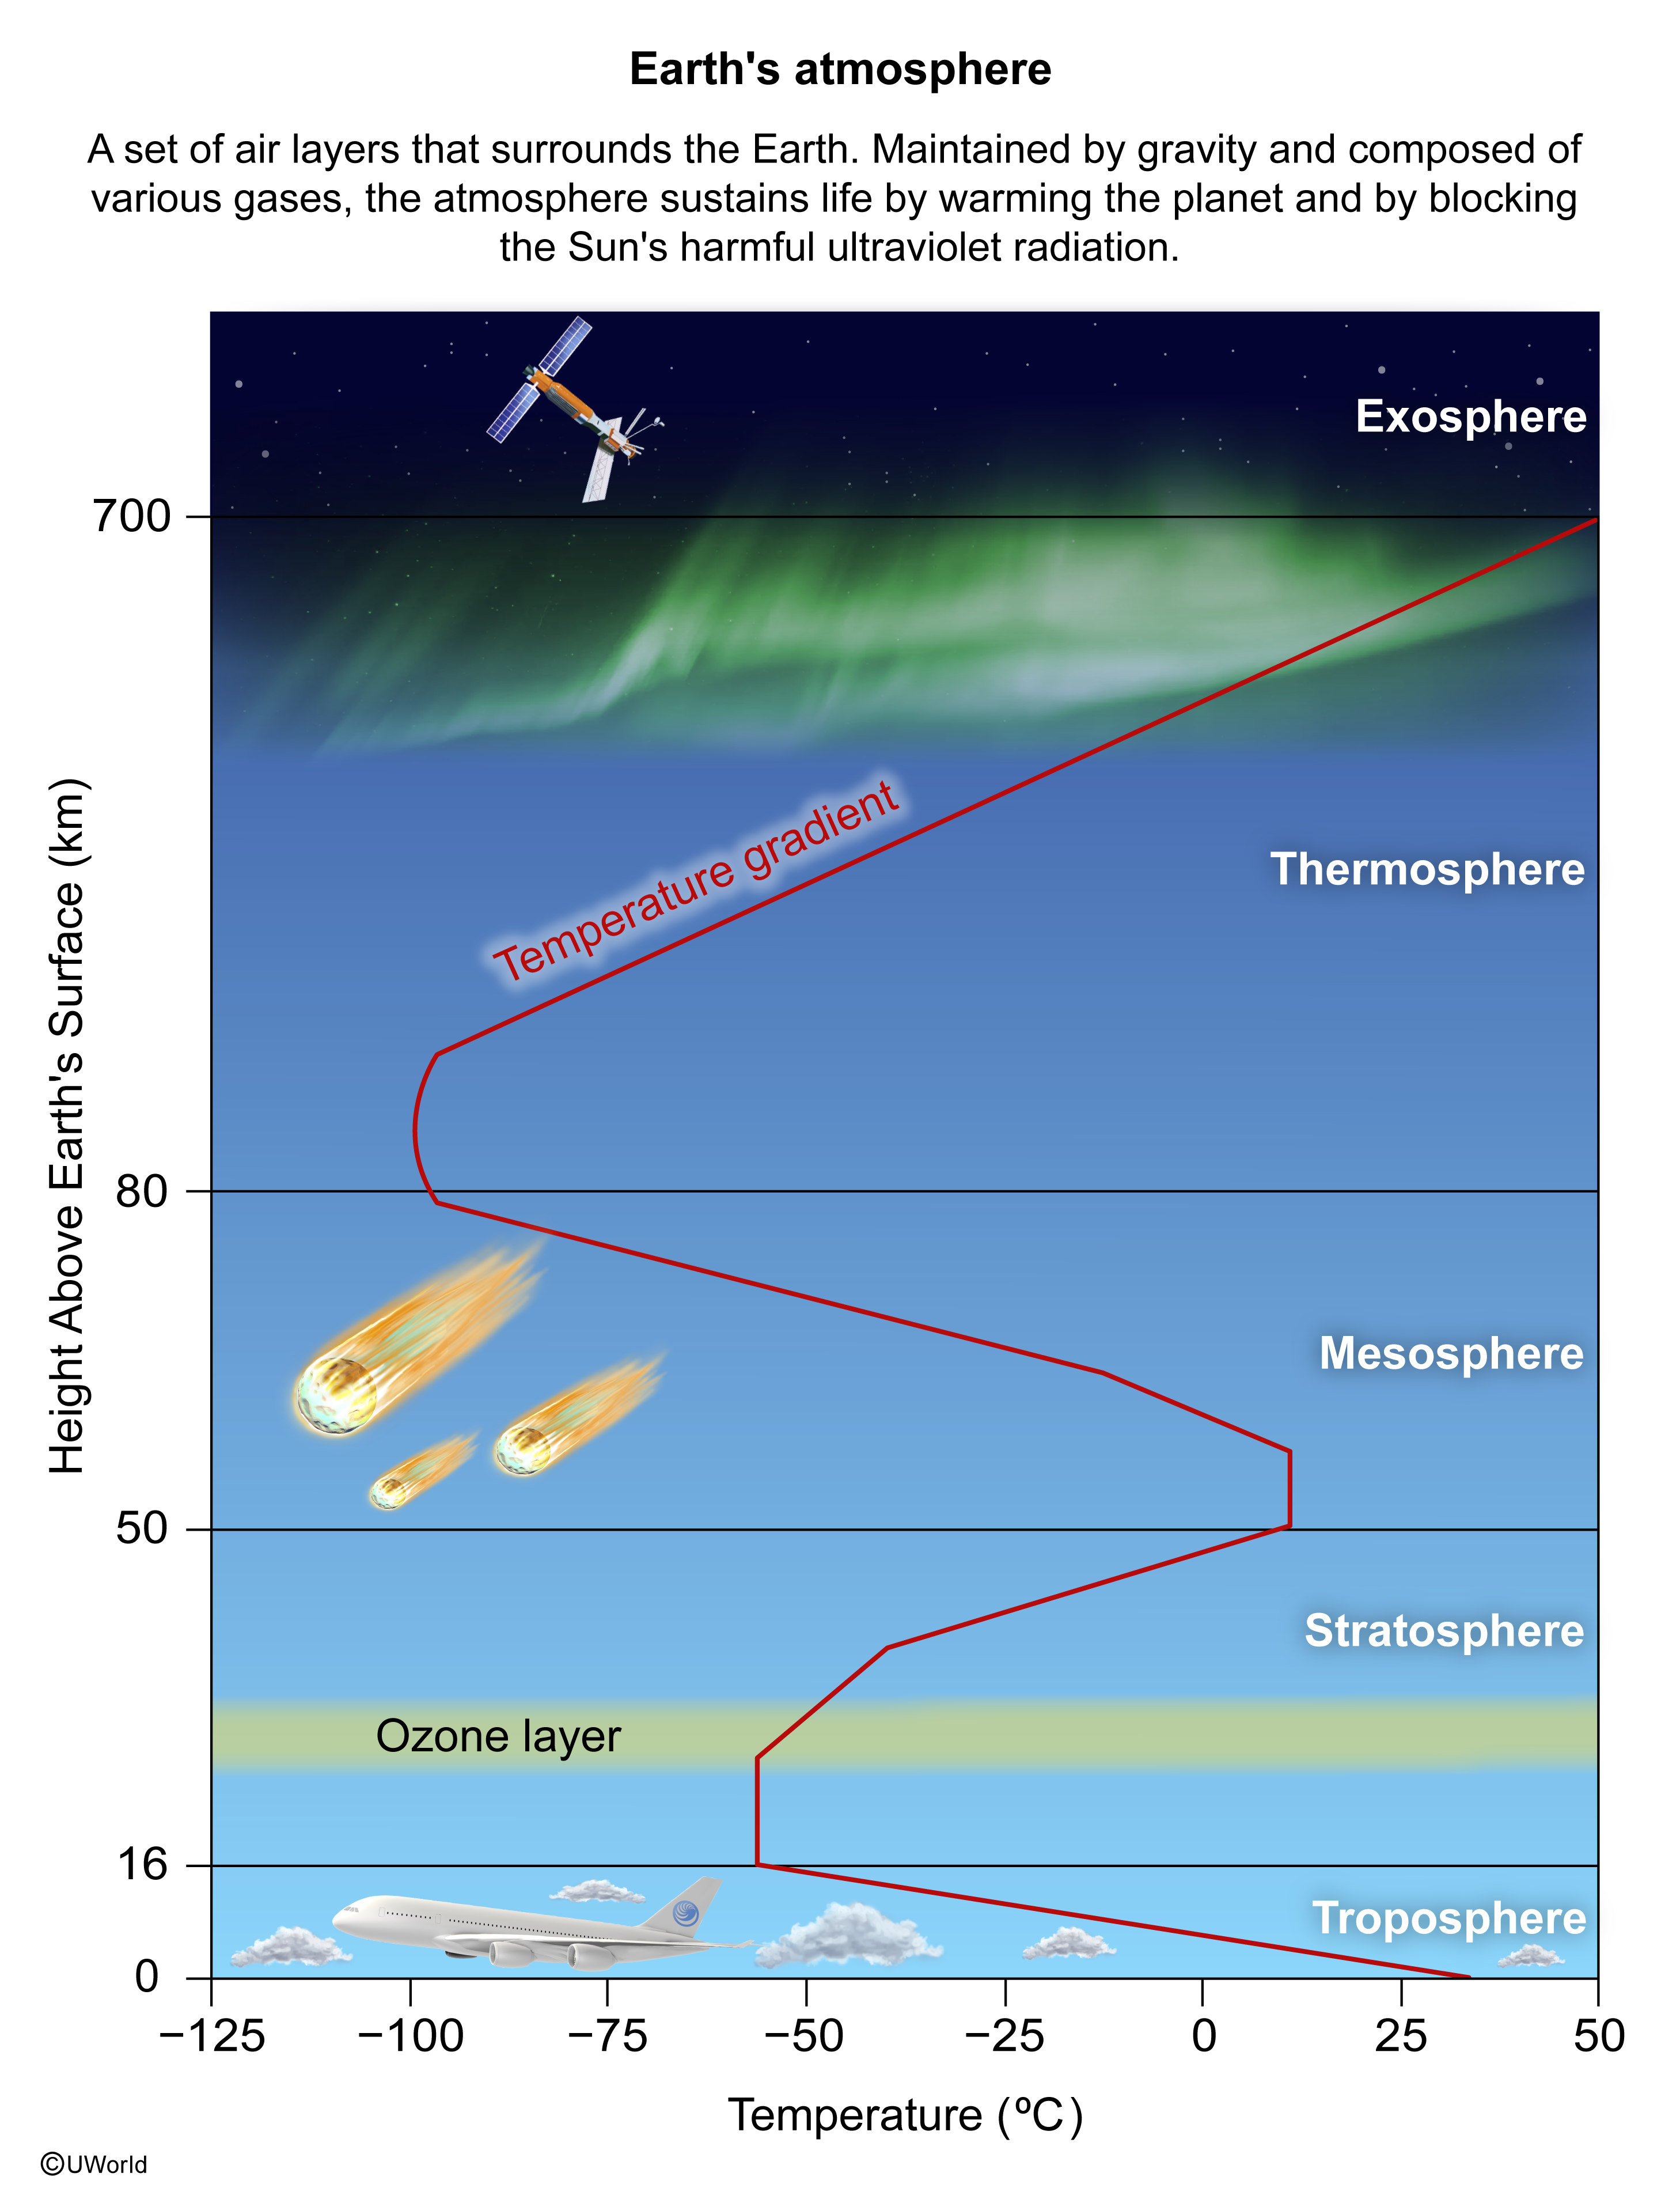
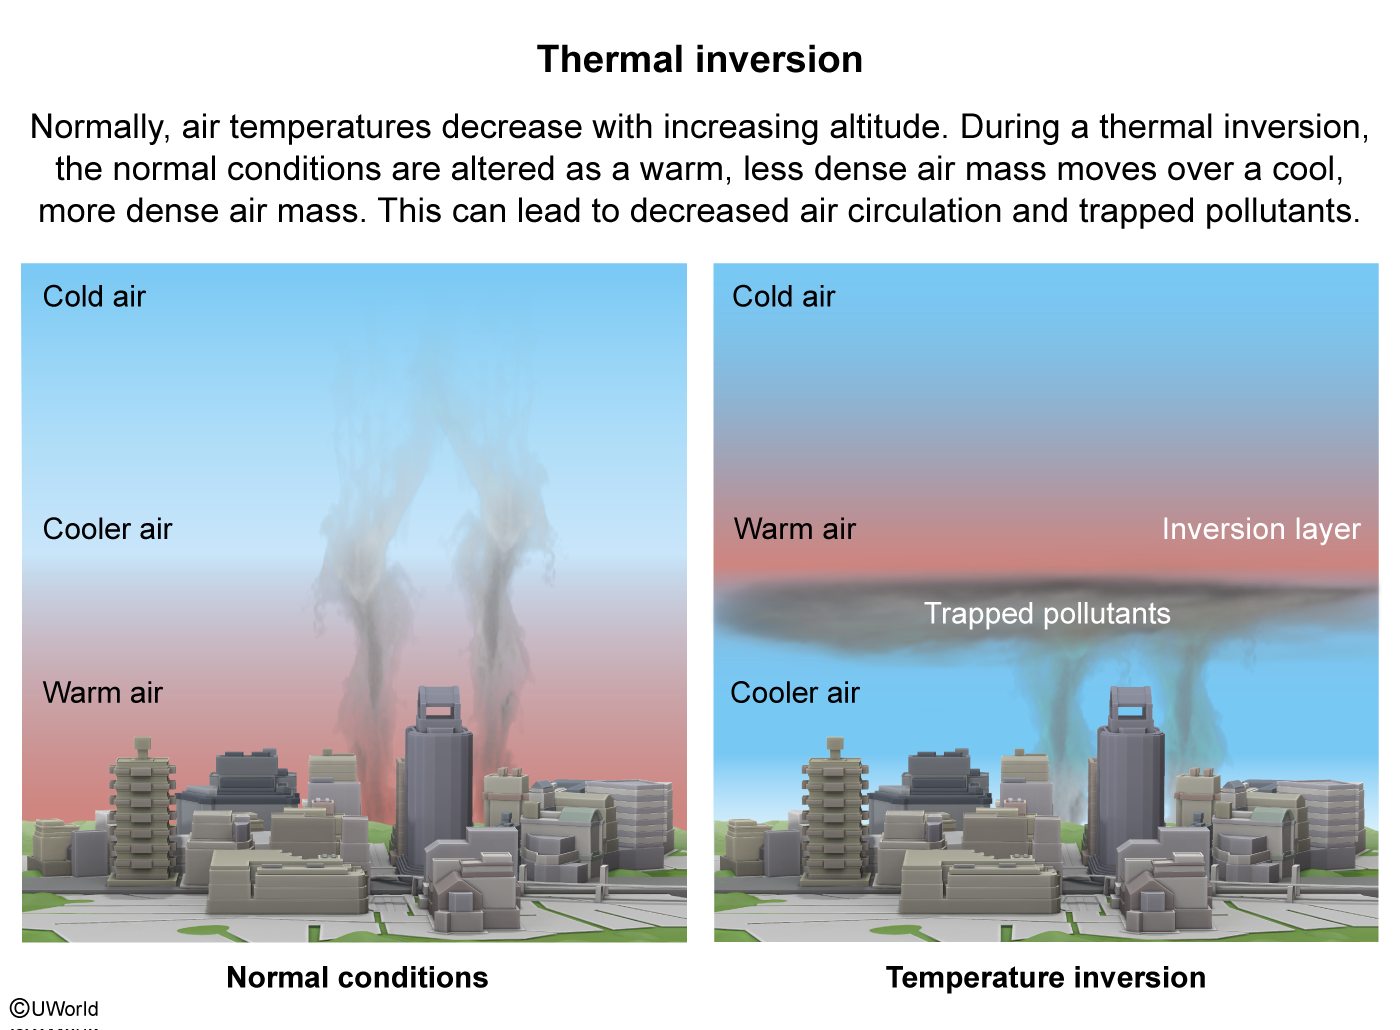
| C. Thermal inversions occur more readily with climate change, impacting the formation of ozone in the stratosphere. | |
| D. Climate change poses a threat to the availability of habitat and food for organisms in polar regions. |
Explanation

Throughout Earth's history, the prevailing climate (average temperature and rainfall over time) has varied, with cyclical periods of warming and cooling. However, in recent history, anthropogenic activities have contributed to a period of significant warming, which has influenced Earth's biotic and abiotic factors in many ways.
For example, as temperatures rise, the snow and ice in polar regions begin to melt. Because many polar species, such as polar bears and seals, are adapted to snow and ice, changes in the climate of polar regions impact their survival by reducing the availability of habitat and food.
(Choice A) Increased atmospheric carbon dioxide levels from climate change can promote photosynthesis and plant growth that would increase, not slow, the rate of carbon dioxide storage in producers.
(Choice B) A narrow range of tolerance would limit the temperatures that organisms are adapted to and would not protect species from fluctuations in the temperature.
(Choice C) Thermal inversions do not impact the formation of the ozone layer.
Things to remember:
As the climate changes and surface temperatures warm, snow and ice in
polar regions melt, resulting in decreased habitat and availability of food for some polar species.
Passage
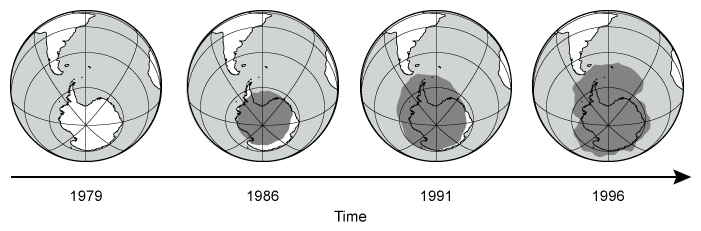
The diagram below shows stratospheric ozone depletion over time.
Question
Which of the following best explains an anthropogenic cause of the ozone depletion illustrated in the diagram?
| A. Increased atmospheric sulfur dioxide concentrations from the burning of fossil fuels and vehicle emissions. | |
| B. Increased atmospheric sulfur dioxide concentrations from volcanic eruptions and coal-burning power plants. | |
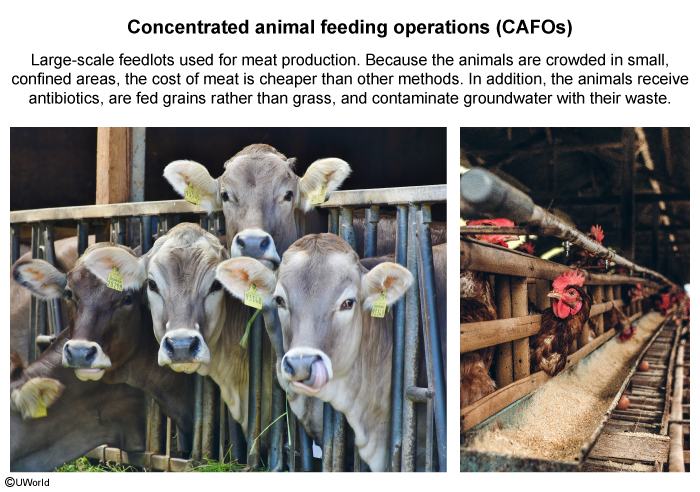
| C. Increased atmospheric chlorofluorocarbon concentrations from concentrated animal feeding operations and integrated pest management practices. | |
| D. Increased atmospheric chlorofluorocarbon concentrations from aerosol sprays and refrigerants. |
Explanation

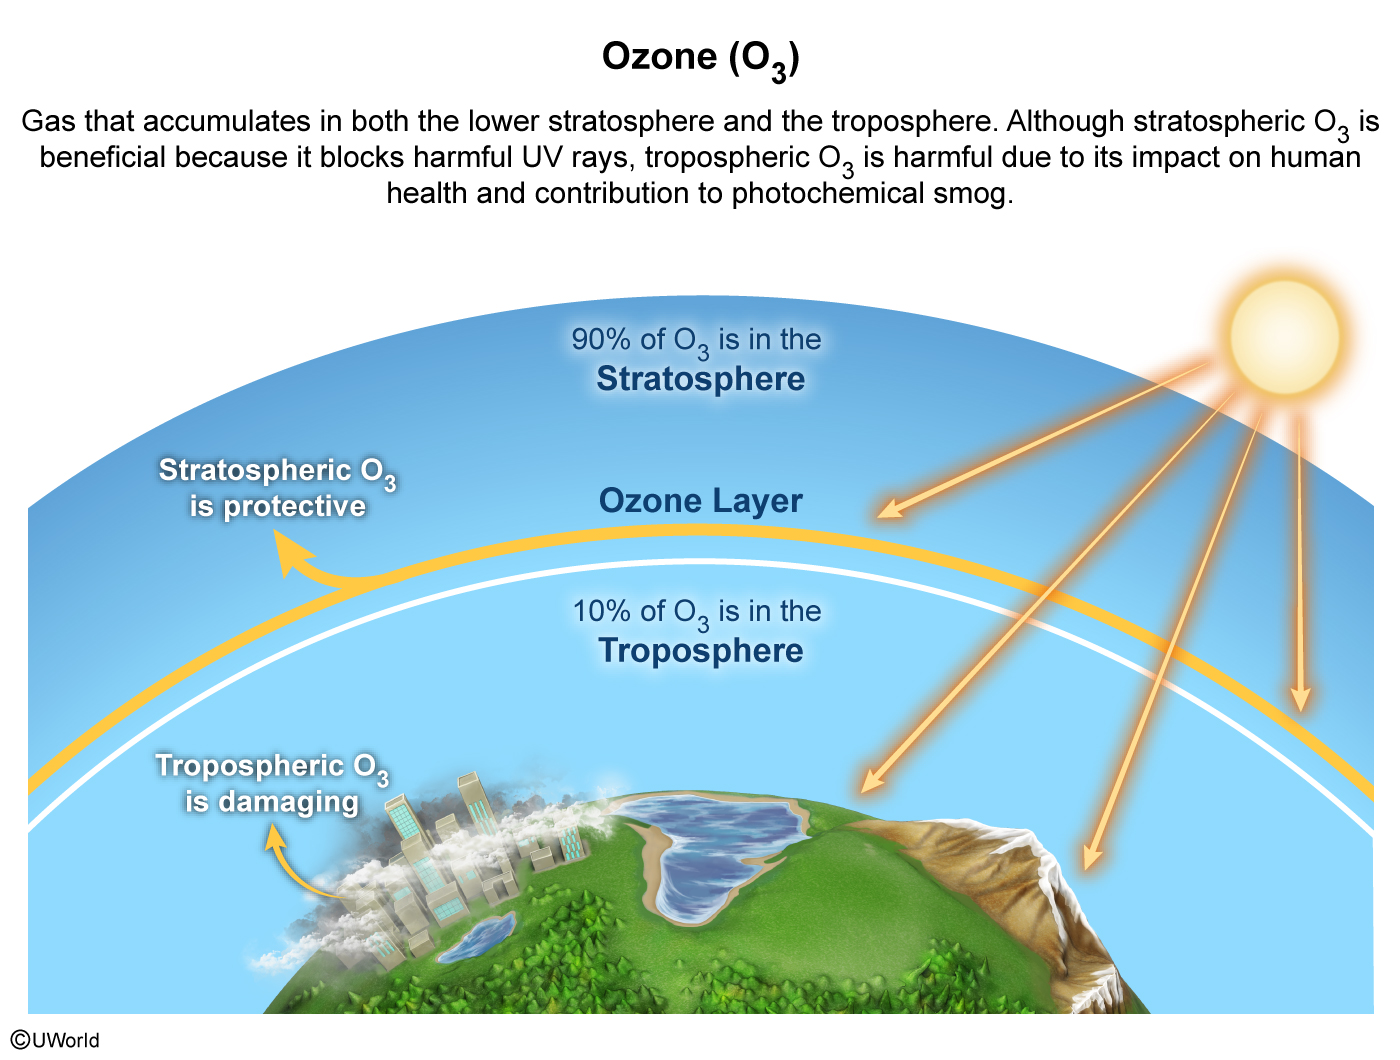
In the early 20th century, chlorofluorocarbons (CFCs) were synthesized as an inexpensive and effective group of gases that could be used in aerosol sprays and in cooling systems. By the 1960s, CFCs were widely used in automobiles, homes, and office buildings.
However, in the early 1970s, scientists discovered that chlorine atoms in CFCs could destroy stratospheric ozone. When the depletion of the ozone layer above Antarctica was observed in the mid-1980s, scientists quickly connected it to CFCs. Therefore, increased atmospheric chlorofluorocarbon concentrations from aerosol sprays and refrigerants is the best explanation for an anthropogenic cause of the ozone depletion illustrated in the diagram.
(Choices A and B) Although sulfur dioxide is produced by the combustion of fossil fuels and volcanic eruptions, it does not contribute to the depletion of the ozone layer.
(Choice C) Concentrated animal feeding operations and integrated pest management practices are not sources of CFCs and do not increase atmospheric CFC concentrations.
Things to remember:
Anthropogenic causes of stratospheric ozone depletion include the
emissions of chlorofluorocarbons (CFCs), a group of gases extensively used in the early 20th century.


I got BIG improvement learning from this platform.
Before, I had a hard time studying and staying focused because it was just boring, but now with UWorld, not only can I focus, but I actually feel motivated to learn!
The explanations were clear and I could practice the question based on units. I got a 5 in the end!! So, I think it’s very helpful and I’ll be using it to study for my future exams 🙂 You guys provide so many different functions to help students like me, and I really appreciate it, it’s really worth the money.